Prometheus is an open-source monitoring and alerting toolkit that is widely used for collecting and querying time series data. One of its key features is the ability to scrape metrics from various targets using HTTP-based endpoints. Prometheus scrapes these endpoints at regular intervals to gather metrics and monitor the performance of the target system.
Services like Django and Nginx come equipped with pre-built Prometheus metrics endpoints, simplifying the process of gathering performance data by enabling in a config file or adding a library. Some out of the box examples are Django, Nginx, MySQL, Apache, etc.
But what if we want to create our own custom scrapable endpoint? Luckily, Prometheus gives us libraries to do just that. In this tutorial I will use the prometheus_client library in Python to fetch metrics from Twitch via the Twitch API. Then I’ll create an endpoint for a Prometheus ServiceMonitor to scrape.
Setup
I created the following Python container running in Kubernetes:
from prometheus_client import start_http_server, Counter, Summary, Gauge
import time
import requests
import os

# Create a metric to track time spent and requests made.
REQUEST_TIME = Summary('request_processing_seconds',
                       'Time spent processing request')

# Get Viewer Count
@REQUEST_TIME.time()
def process_user_request():
    api_url = "https://api.twitch.tv/helix/streams?user_login=mst3k
    headers =  {
        'Client-Id': os.getenv('TWITCH_CLIENT'),
        "Authorization":'Bearer ' + os.getenv('TWITCH_KEY'),
    }
    response = requests.get(api_url, headers=headers)
    print("Grabbing active users...")

    if not response.json()["data"]:
        return 0
    else:
        return(response.json()["data"][0]["viewer_count"])

# Get Game Viewer Count
@REQUEST_TIME.time()
def process_game_request(game_id=None):

    if game_id:
        api_url = "https://api.twitch.tv/helix/streams?first=10&game_id="\
        + game_id
    else:
        api_url = "https://api.twitch.tv/helix/streams"

    headers =  {
        'Client-Id': os.getenv('TWITCH_CLIENT'),
        "Authorization":'Bearer ' + os.getenv('TWITCH_KEY'),
    }
    response = requests.get(api_url, headers=headers)
    print("Grabbing game active users...")

    if not response.json()["data"]:
        return 0
    else:
        return(response.json()["data"])

if __name__ == '__main__':
    active_users           = Gauge('twitch_active_users',
    'Twitch Active Users')
    game_active_users      = Gauge('twitch_game_active_users',
    'Twitch Game Active Users', ["user_name", "type", "language"])
    streaming_active_users = Gauge('twitch_stream_active_users',
    'Twitch Streaming Active Users', ["game_name", "type", "language"])

    # Start up the server to expose the metrics.
    start_http_server(8000)
    # Generate some requests.
    while True:
        active_users.set(process_user_request())

        #get game active users
        games = process_game_request(os.getenv('TWITCH_GAME_ID'))
        for game in games:
            game_active_users.labels(user_name=game["user_name"],
            type=game["type"], language=game["language"]).set(game["viewer_count"])

        #get streaming active users
        streams = process_game_request()
        for stream in streams:
            streaming_active_users.labels(game_name=stream["game_name"],
            type=stream["type"], language=stream["language"]).set(stream["viewer_count"])

        #sleep for 60 seconds
        time.sleep(60)
Next, I set three Gauge metric types, some with labels. I will use labels to filter Grafana dashboards later.
active_users           = Gauge('twitch_active_users',
 'Twitch Active Users')
game_active_users      = Gauge('twitch_game_active_users',
 'Twitch Game Active Users', ["user_name", "type", "language"])
streaming_active_users = Gauge('twitch_stream_active_users',
 'Twitch Streaming Active Users', ["game_name", "type", "language"])
1. active_users: metric name is twitch_active_users with no labels.
2. game_active_users: metric name is twitch_game_active_users with labels “user_name”, “type”, “language”..
3. streaming_active_users: metric name is twitch_stream_active_users with labels “game_name”, “type”, “language”.
Finally I start the metric http server using start_http_server(8000) which is provided by the prometheus_client library. This will start the http server on port 8000 exposing the custom metrics.
Now I’ll create a Service pointing at the metric port:
apiVersion: v1
kind: Service
metadata:
 name: twitch-scraper
 labels:
   run: twitch-scraper
spec:
 ports:
 - port: 8000
   name: active-users
 selector:
   run: twitch-scraper
Once I have a Service exposed to the metrics endpoint called active-users, I’ll create a ServiceMonitor:
apiVersion: monitoring.coreos.com/v1
kind: ServiceMonitor
metadata:
  name: twtich-scraper
  namespace: monitoring
  annotations:
    meta.helm.sh/release-name: prometheus
    meta.helm.sh/release-namespace: monitoring
  labels:
    app.kubernetes.io/component: metrics
    jobLabel: twitch-exporter
    release: prometheus
spec:
  selector:
    matchLabels:
      run: twitch-scraper
  namespaceSelector:
    any: true
  endpoints:
    - port: active-users
      interval: 30s
      path: /
That’s it! Now Prometheus can access the metric endpoint and will automatically start scraping data. Lets see what this looks like when I curl the metric endpoint from a pod running in the same Kubernetes cluster:
$ curl http://twitch-scraper:8000/

# HELP twitch_active_users Twitch Active Users
# TYPE twitch_active_users gauge
twitch_active_users 517.0
# HELP twitch_game_active_users Twitch Game Active Users
# TYPE twitch_game_active_users gauge
twitch_game_active_users{language="de",type="live",user_name="Papaplatte"} 23828.0
twitch_game_active_users{language="de",type="live",user_name="BastiGHG"} 14629.0
twitch_game_active_users{language="pt",type="live",user_name="Forever"} 6906.0
twitch_game_active_users{language="de",type="live",user_name="LetsHugoTV"} 4926.0
twitch_game_active_users{language="en",type="live",user_name="Tubbo"} 5107.0
twitch_game_active_users{language="ru",type="live",user_name="ZakvielChannel"} 3944.0
twitch_game_active_users{language="ko",type="live",user_name="아라하시_타비"} 2934.0
# HELP twitch_stream_active_users Twitch Streaming Active Users
# TYPE twitch_stream_active_users gauge
twitch_stream_active_users{game_name="Fortnite",language="es",type="live"} 50250.0
twitch_stream_active_users{game_name="League of Legends",language="es",type="live"} 15534.0
twitch_stream_active_users{game_name="Fortnite",language="en",type="live"} 34728.0
twitch_stream_active_users{game_name="Just Chatting",language="tr",type="live"} 17252.0
twitch_stream_active_users{game_name="Minecraft",language="de",type="live"} 14629.0
twitch_stream_active_users{game_name="Fortnite",language="ru",type="live"} 21958.0
twitch_stream_active_users{game_name="Fortnite",language="fr",type="live"} 20082.0
twitch_stream_active_users{game_name="Just Chatting",language="en",type="live"} 14463.0
twitch_stream_active_users{game_name="Dead by Daylight",language="en",type="live"} 16775.0
twitch_stream_active_users{game_name="League of Legends",language="ko",type="live"} 16624.0
twitch_stream_active_users{game_name="Suika Game",language="en",type="live"} 19220.0
twitch_stream_active_users{game_name="Grand Theft Auto V",language="ja",type="live"} 14478.0
twitch_stream_active_users{game_name="World of Warcraft",language="en",type="live"} 14412.0
twitch_stream_active_users{game_name="League of Legends",language="en",type="live"} 13640.0
Sweet!
Setting Metrics
But how did we set these metrics? Here I will list the ways to set our three Gauge metrics with graph examples.
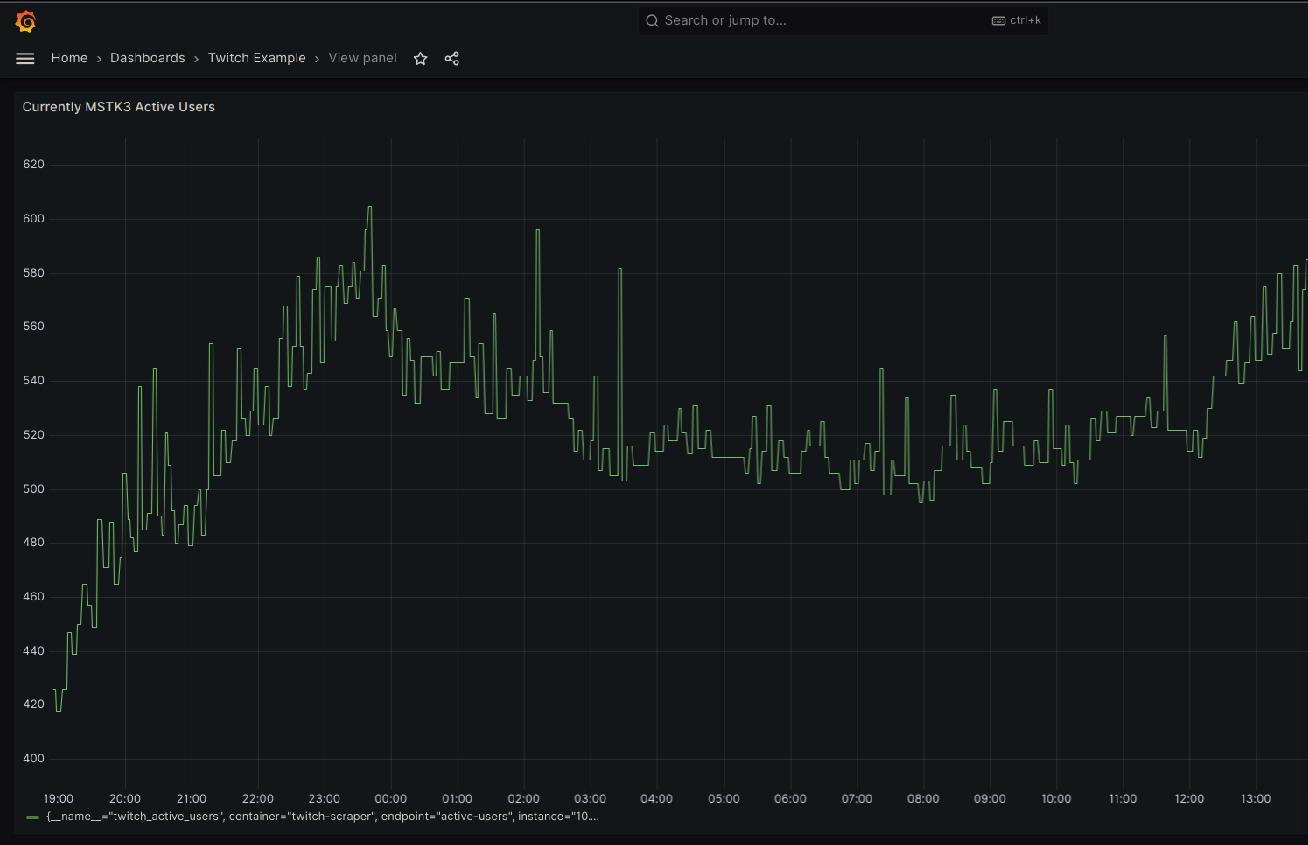
Twitch Active Users
In this example, I am fetching metrics from the 24 hour streaming channel Mystery Science Theater 3000.
def process_user_request():
    api_url = "https://api.twitch.tv/helix/streams?user_login=mst3k
    headers =  {
        'Client-Id': os.getenv('TWITCH_CLIENT'),
        "Authorization":'Bearer ' + os.getenv('TWITCH_KEY'),
    }
    response = requests.get(api_url, headers=headers)
    print("Grabbing active users...")

    if not response.json()["data"]:
        return 0
    else:
        return(response.json()["data"][0]["viewer_count"])
Here I only care what the current viewer_count is, which is the only thing the process_user_request function returns. Since there are no labels, the only thing I have to set in the Gauge is the viewer_count:
active_users.set(process_user_request())
Now that this endpoint is being scraped, lets make a graph looking at the MST3K viewer count in the last 24 hours using the search query:
twitch_active_users
Twitch Top Minecraft Active Streamers
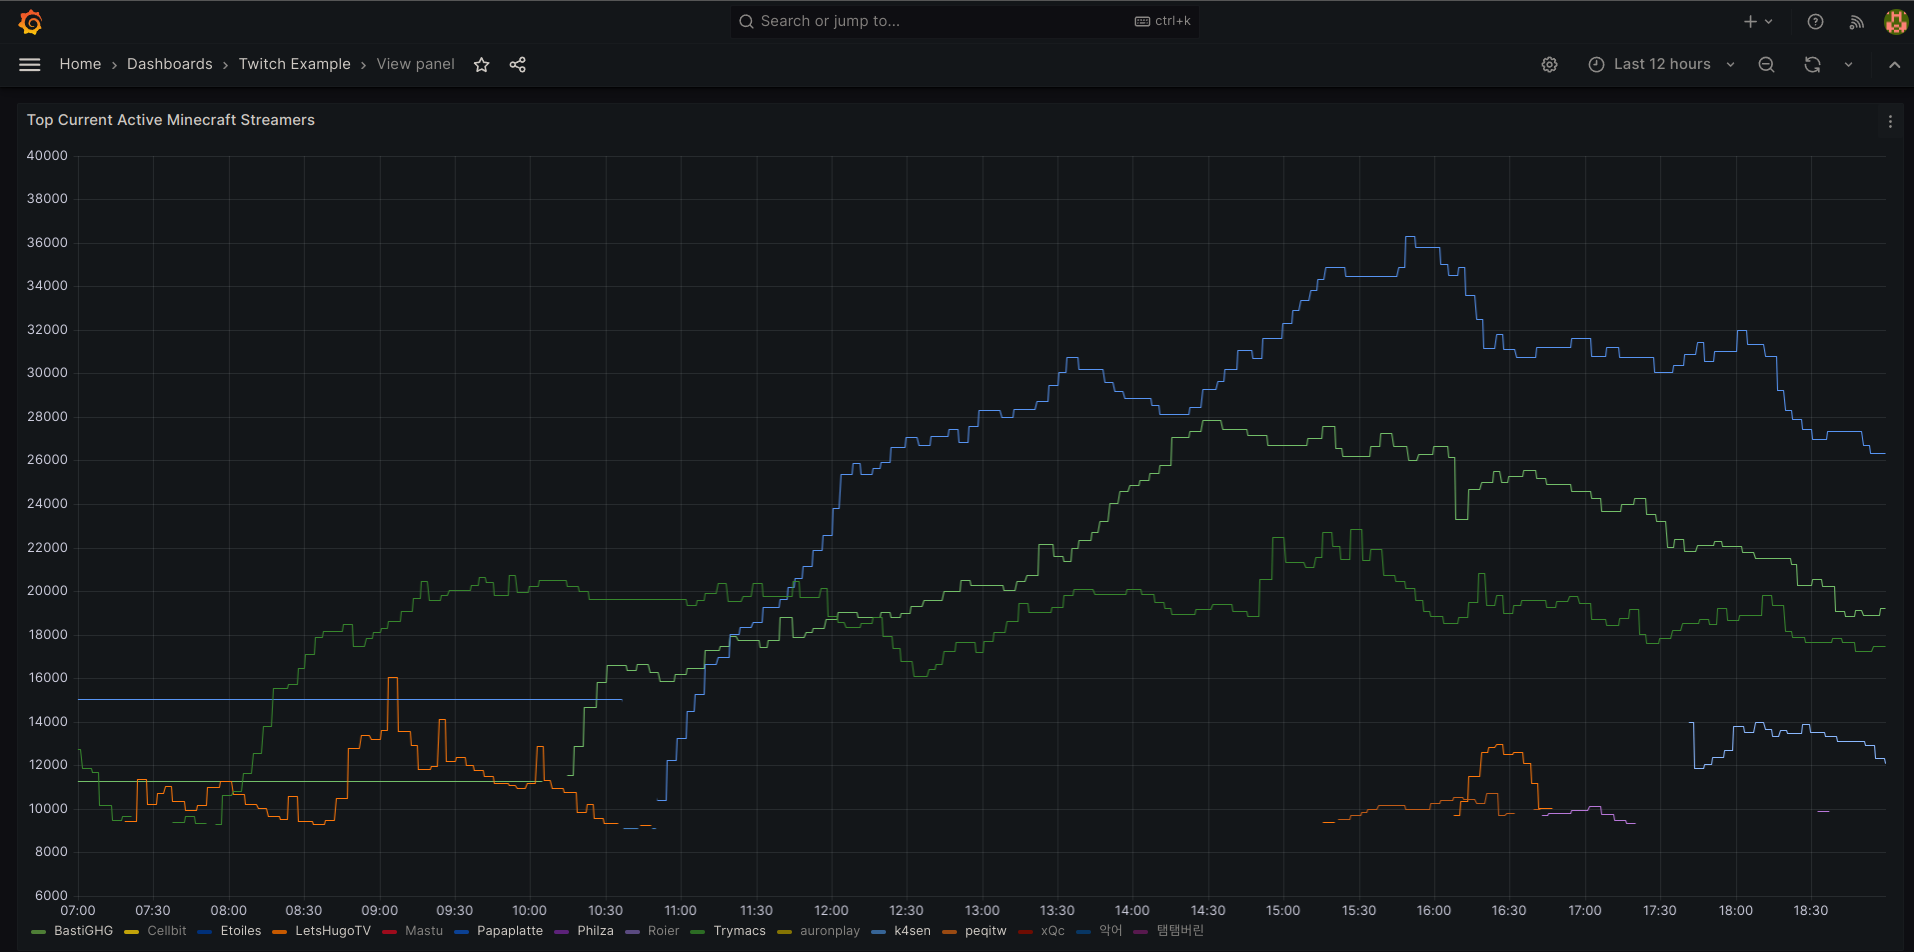
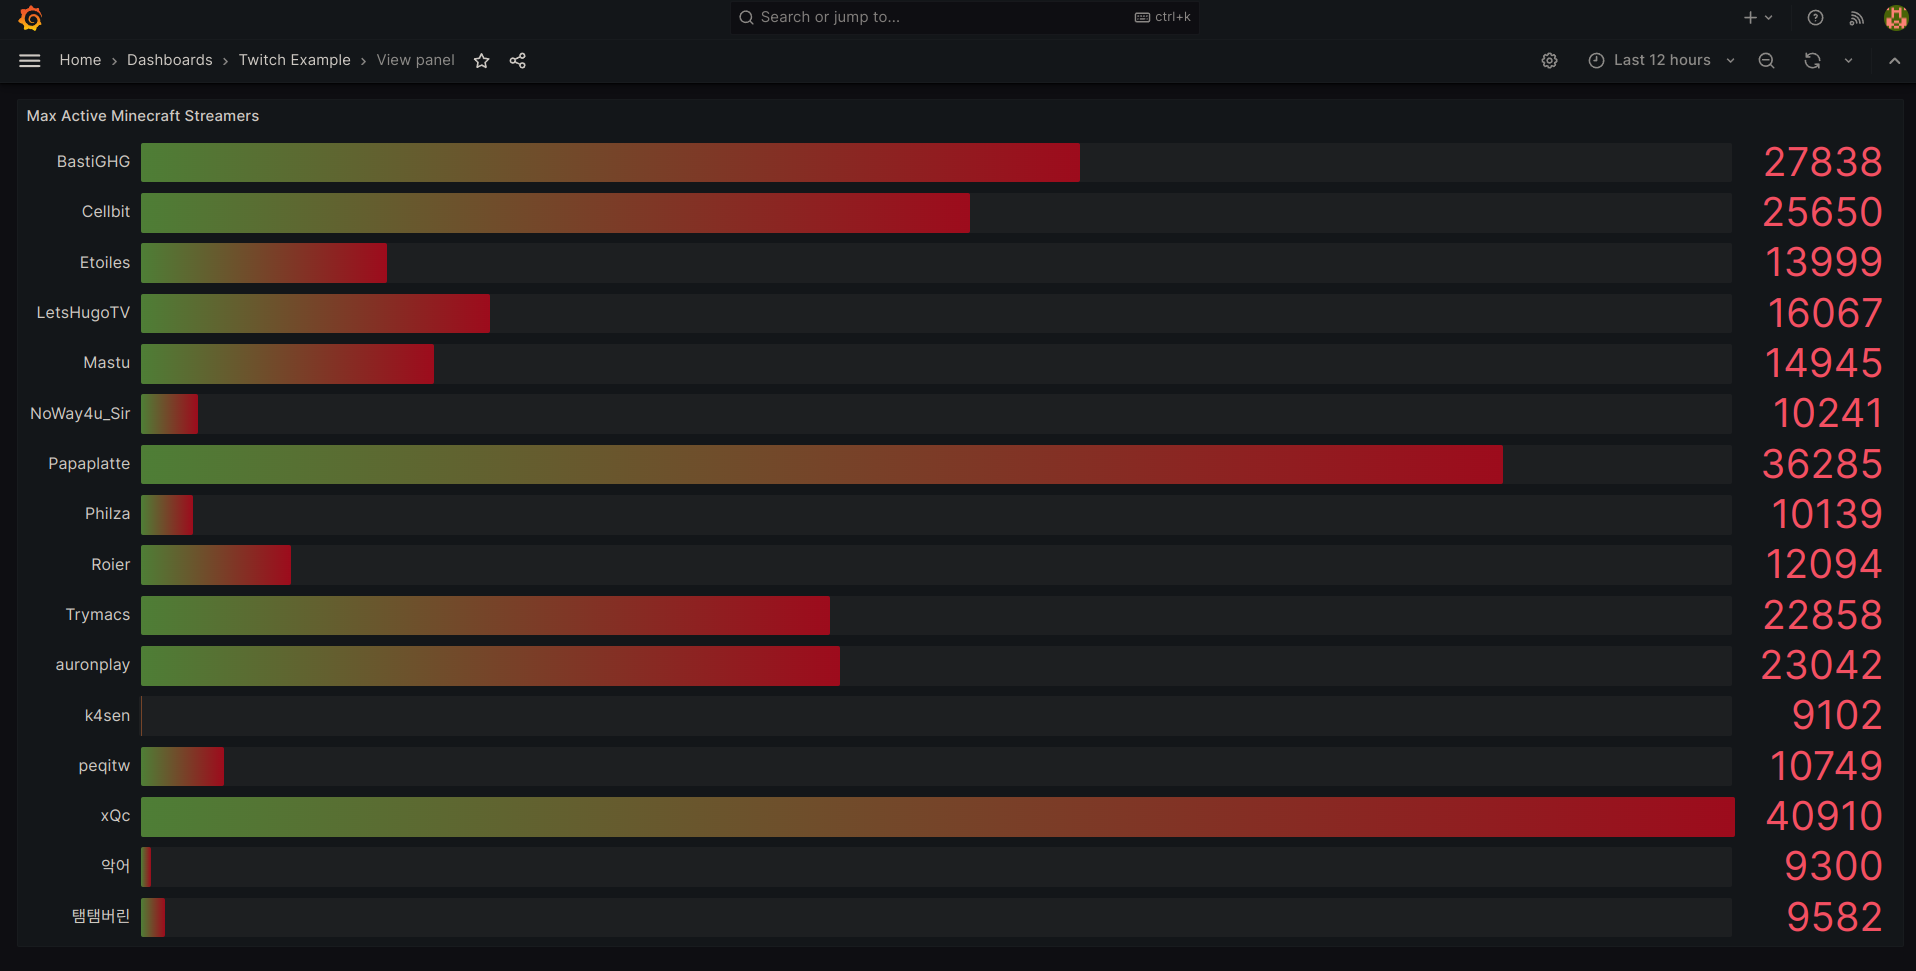
In this example, I am fetching metrics for the streamers with the most active users playing the game Minecraft.
@REQUEST_TIME.time()
def process_game_request(game_id=None):

    if game_id:
        api_url = "https://api.twitch.tv/helix/streams?first=10&game_id="\
        + game_id
    else:
        api_url = "https://api.twitch.tv/helix/streams"

    headers =  {
        'Client-Id': os.getenv('TWITCH_CLIENT'),
        "Authorization":'Bearer ' + os.getenv('TWITCH_KEY'),
    }
    response = requests.get(api_url, headers=headers)
    print("Grabbing game active users...")

    if not response.json()["data"]:
        return 0
    else:
        return(response.json()["data"])
The process_game_request function using the Minecraft GAME_ID will return a list of the top 10 streamers playing the game.
Next, I will set the Gauge value with viewer_count and labels for each streamer.
games = process_game_request(os.getenv('TWITCH_GAME_ID'))
for game in games:
  game_active_users.labels(user_name=game["user_name"],
    type=game["type"], language=game["language"]).set(game["viewer_count"])
With this data, let’s display the top Minecraft streamers using the search query:
topk(10, max(twitch_game_active_users) by (user_name))
Twitch Top Streaming Games
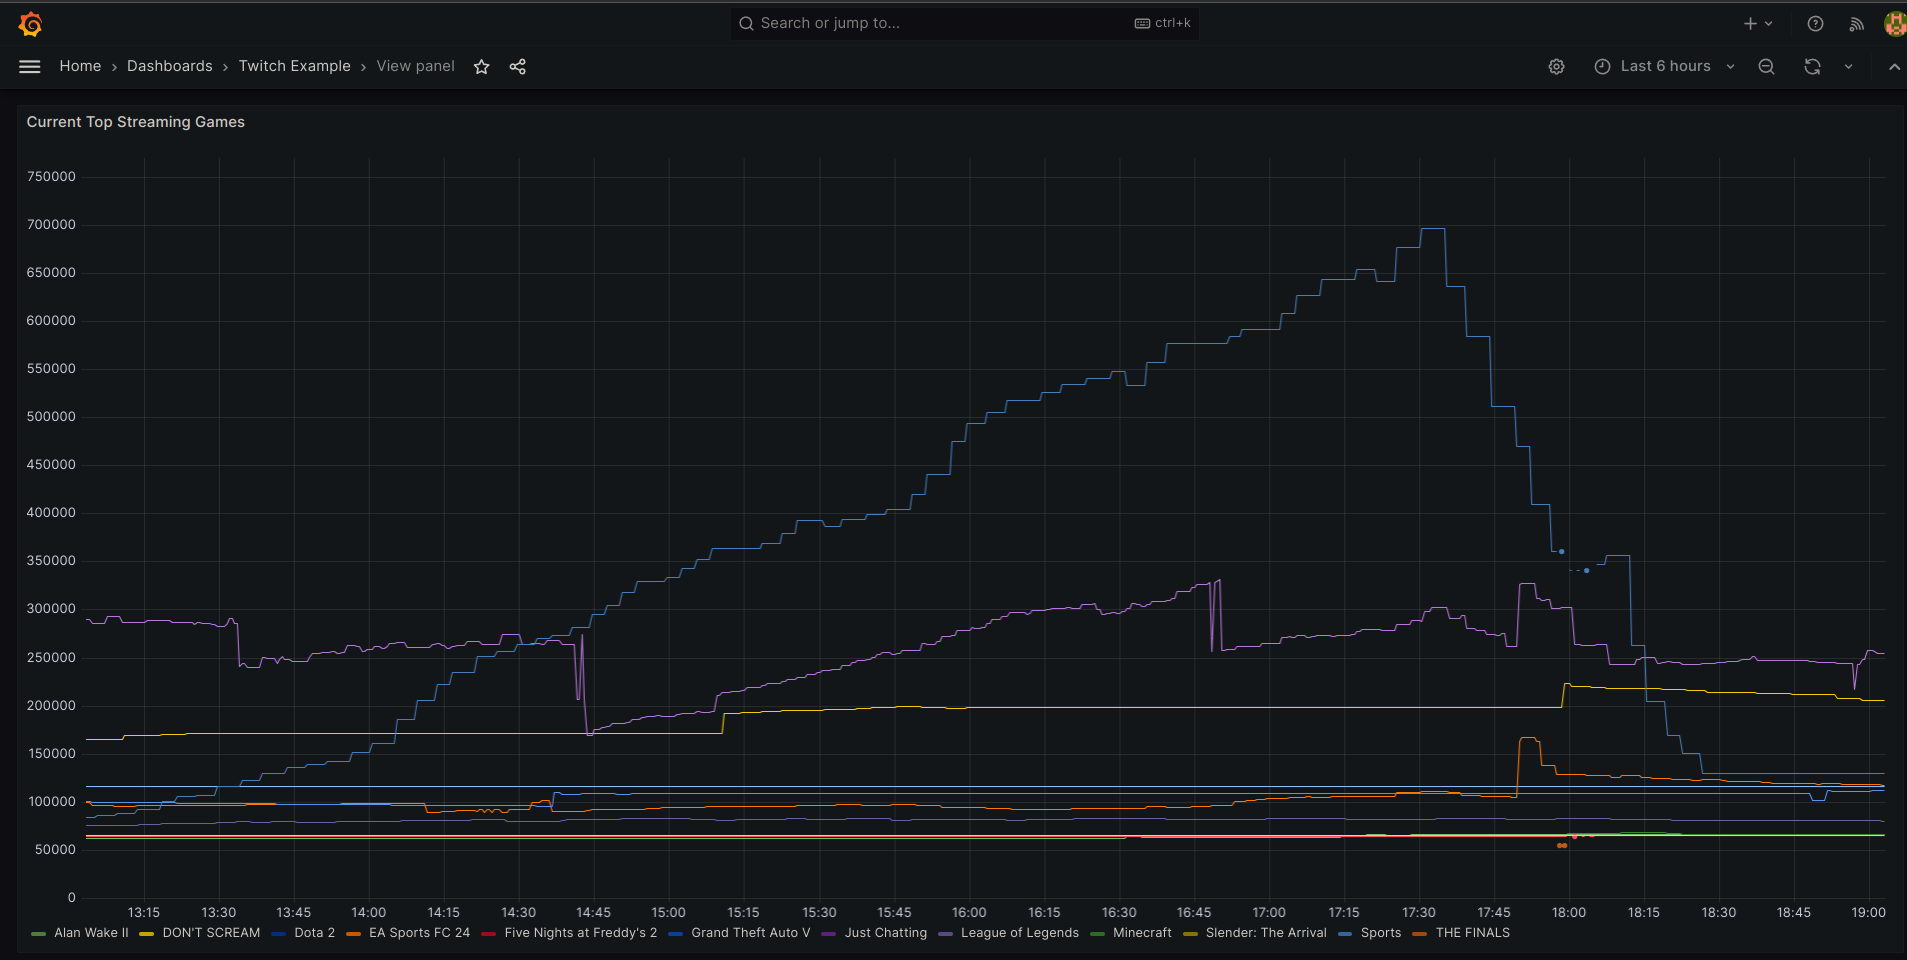
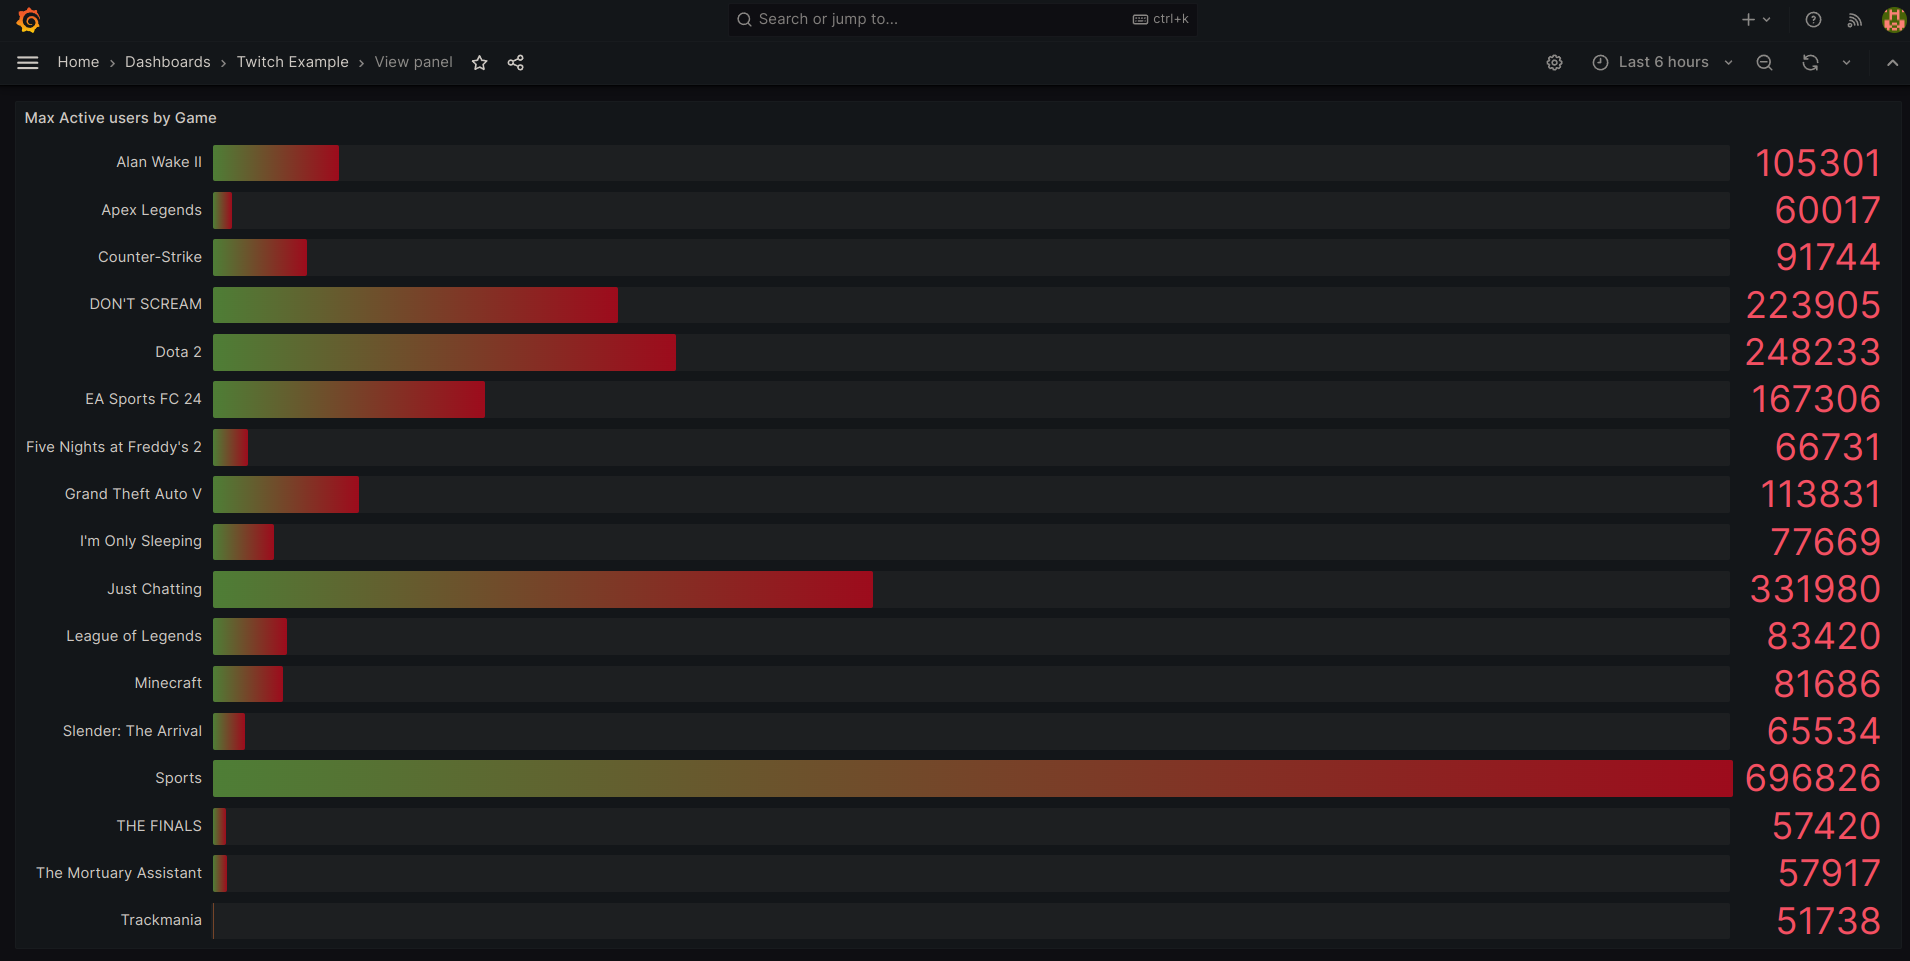
In this example, I am fetching metrics for the highest viewer_count per game using the same process_game_request function with no GAME_ID, which will return the top 100 active streamers.
streams = process_game_request()
for stream in streams:
  streaming_active_users.labels(game_name=stream["game_name"],
    type=stream["type"], language=stream["language"]).set(stream["viewer_count"])
If we filter using game_name, we can get the top 10 streaming games:
topk(10, sum(twitch_stream_active_users) by (game_name))
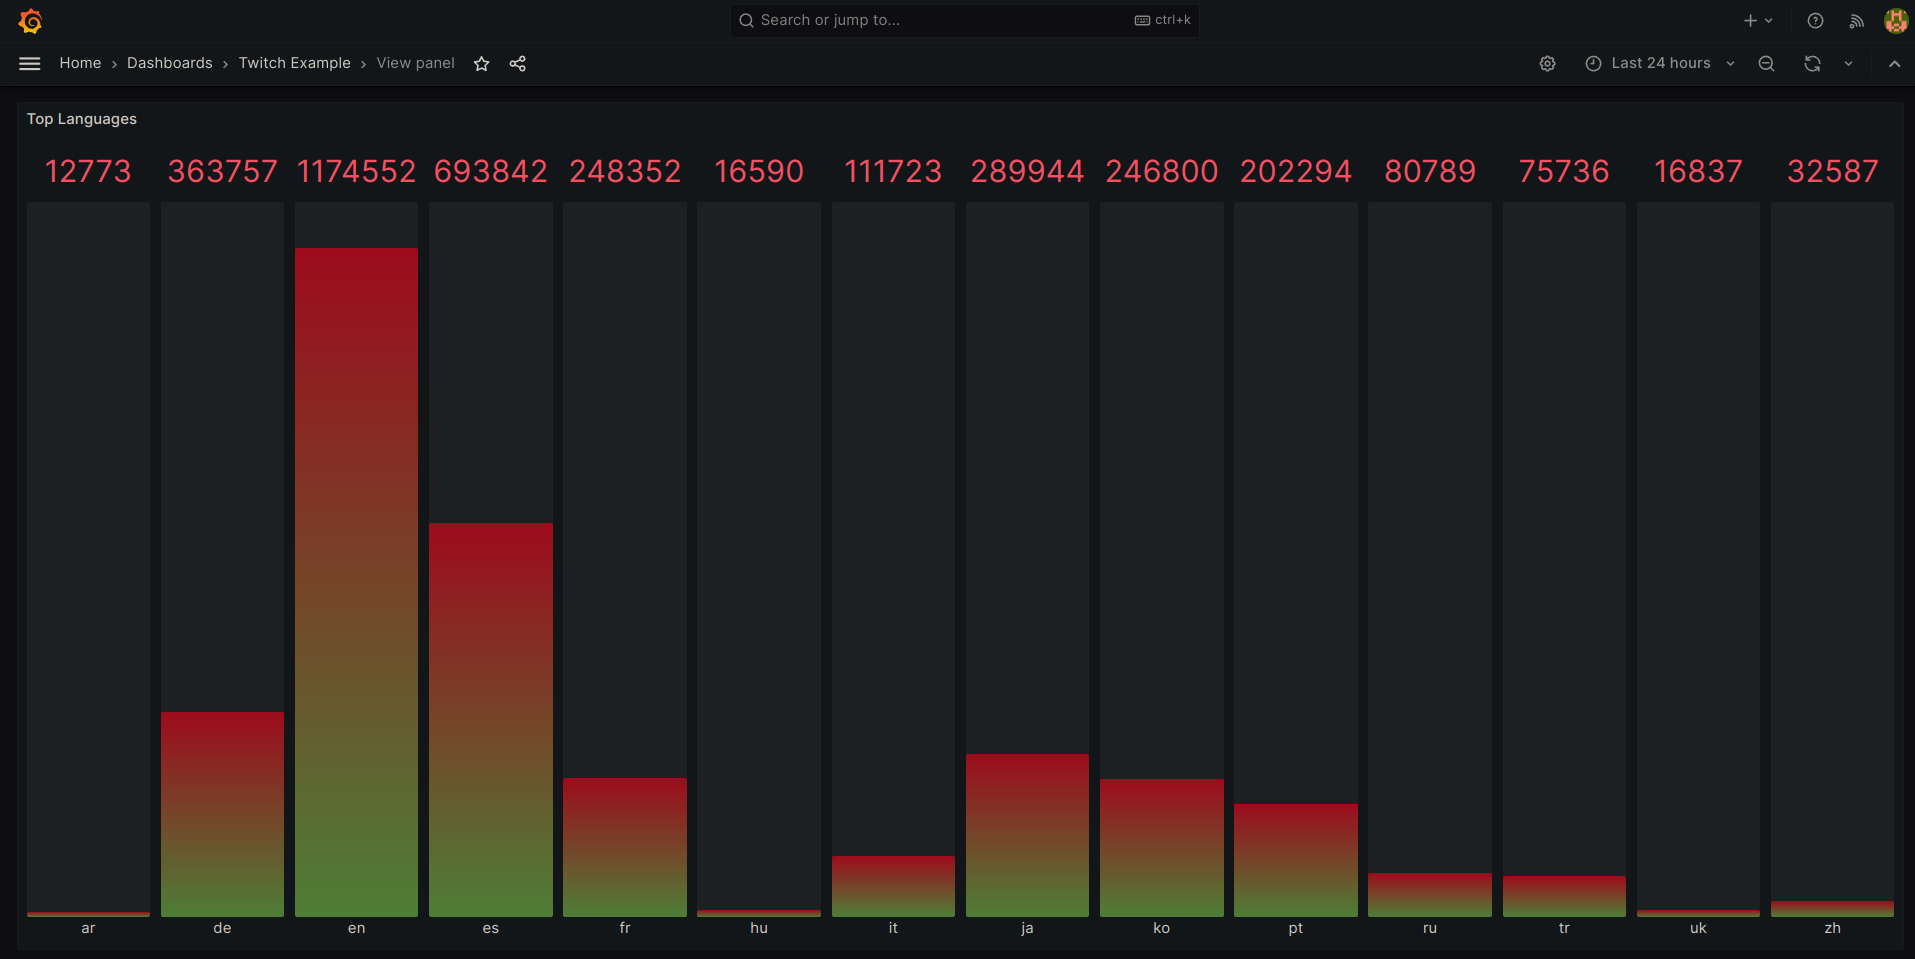
We can also see the top languages using the following search query:
sum(twitch_stream_active_users) by (language)
Conclusion
This is a very basic guide on creating your own custom metric endpoint for Prometheus. There are other metrics types like Counter and Histogram to check out, and loads more libraries for your language of choice.
Good luck!
