
As I’ve written in the past, large numbers of small files make for an inefficient data lake. But sometimes, you can’t avoid small files. Our CloudTrail repository, for example, has 4,601,675 files as-of this morning, 44% of which are under 1,000 bytes long. Just listing those files with the AWS CLI takes over 20 minutes!
In this post, I develop a Lambda to aggregate these files, storing them in a new S3 location partitioned by date. Along the way I call out some of the challenges that face such a Lambda. If you want to try it out yourself, you’ll find source code here.
Invoking the Lambda
One of the great things about Lambda is that it can be invoked in many ways: directly via the AWS SDK, as the target of an Application Load Balancer or API Gateway, via an event source mapping from a service such as Kinesis or SQS, or as the target of an EventBridge schedule.
For this use-case, I believe that triggering the Lambda from Simple Queue Service (SQS) is the best approach:
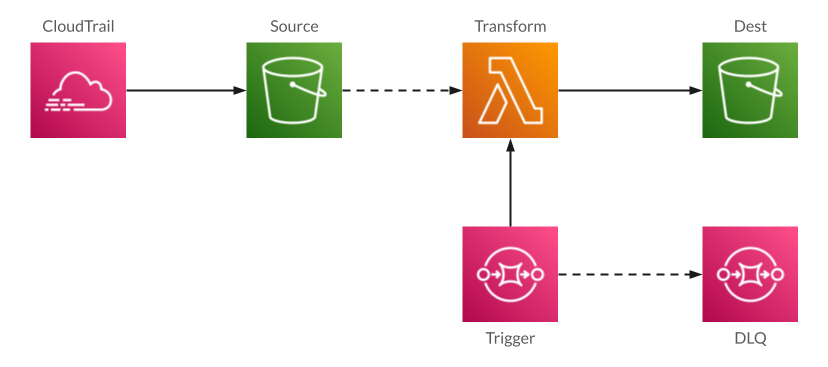
SQS is a “traditional” message queue, designed for the case where a pool of workers pull messages off the queue and process them. It’s nicely integrated with Lambda: SQS will automatically invoke a Lambda when messages are in the queue, it can run concurrent Lambdas to process a backlog of messages, it can retry if the Lambda fails, and best of all, it will move messages to a “dead-letter queue” (DLQ) if they repeatedly fail. We’ll revisit this last feature in a later section.
SQS Concurrency
The SQS-Lambda integration gives you two knobs to control execution. The first is how many messages are passed to a single Lambda invocation. Since batches are “all or nothing” – any error causes the batch to be retried – for this use-case a batch size of one makes the most sense.
The other knob is the number of concurrent Lambda invocations. Per the docs, within a few minutes SQS scales from five concurrent executions to a configured maximum or your account’s limit. This is a double-edged sword: it’s great to scale up to hundreds of concurrent invocations to process a backlog, but that can crush a downstream database server or mean that other Lambdas won’t be able to run.
For that reason, I generally recommend setting concurrency to a relatively low number. For this use-case, where we’ll be processing once a day, the minimum setting of 2 is fine. And to process a backlog, you can intentionally raise the limit to a number that doesn’t impact the rest of your environment.
Message Format
Moving on to the actual message. What I originally planned was a JSON message with separate fields for month, day, and year:
{
  "month": 2,
  "day": 14,
  "year": 2024
}
However, that begs the question of what generates those messages and puts them on the queue. For daily operation, EventBridge Scheduler seems the natural choice: set up a schedule that sends a message to SQS every night at 1 AM UTC. However, EventBridge Scheduler sends a message that looks like this:
{
  "version": "0",
  "id": "1065cb7c-3469-41cf-a93d-c1f9343e3e5a",
  "detail-type": "Scheduled Event",
  "source": "aws.scheduler",
  "account": "123456789012",
  "time": "2024-02-13T01:00:00Z",
  "region": "us-east-1",
  "resources": [
    "arn:aws:scheduler:us-east-1:123456789012:schedule/default/cloudtrail-aggregation-daily"
  ],
  "detail": "{}"
}
My Lambda handles both. For the explicit message, it extracts the expected fields. For EventBridge, it looks for the time field, parses it, and extracts the date (note that it then subtracts one day from the provided date, to handle the previous day’s events).
def extract_trigger_message(event):
    records = event['Records']
    if len(records) != 1:
        raise Exception(f"can only process 1 record at a time; received {len(records)}")
    message = json.loads(records[0]['body'])
    if message.get('source') == "aws.scheduler":
        logger.debug("invoked from EventBridge scheduler")
        dt = datetime.fromisoformat(message.get('time')) - timedelta(days=1)
        return dt.month, dt.day, dt.year
    else:
        logger.debug(f"invoked with JSON date: {message}")
        return message["month"], message["day"], message["year"]
You may be asking why I want to support both message formats. The answer is that I don’t always want to invoke from EventBridge. During development, I want to be able to trigger arbitrary messages. And to support a backlog of events, I want the ability to trigger a bunch of days for processing:
dd = date(2023, 12, 1)
while dd <= date(2023, 12, 31):
    msg = json.dumps({"month": dd.month, "day": dd.day, "year": dd.year})
    client.send_message(QueueUrl=QUEUE_URL, MessageBody=msg)
    dd += timedelta(days=1)
Selecting the List of Files
S3 isn’t a filesystem, although it looks like one to the casual user. In a filesystem, there’s a hierarchy of directories that contain files and other directories. If you request a listing for a directory, you’ll get back just the children of that directory. If you want to retrieve a file based on a pathname (eg, foo/bar/baz.txt), then behind the scenes your operating system reads all of the directories in that path.
S3, by comparison, is an object store: each file is uniquely identified by a key. And while keys can contain slashes, making them look like filesystem paths, part of the reason for S3’s performance is that it’s not traversing a directory hierarchy.
Originally, S3 only allowed listing objects by some prefix of the key, and it would list all of the objects with that prefix. For example, if you requested a listing with the prefix foo/, you’d get back foo/bar.txt. You’d also get foo/bar/baz.txt, because it has the same prefix. For that matter, if you requested a listing with the prefix fo, you’d get foo/bar.txt and fountain/baz.txt.
This approach to listing files broke down quickly with large S3 buckets, especially if they had convoluted naming schemes like CloudTrail’s. So, circa 2010, AWS modified the ListObjects API so that you could provide it with a delimiter:
client.list_objects_v2(Bucket="com-example-mybucket", Prefix="foo/", Delimiter="/")
The Delimiter parameter changes the behavior of the API. Without it, you get all of the keys that have the same prefix. With it, you get back a list of keys that don’t have the delimiter (these are similar to files in a directory), and a list of the common prefixes of all other keys (these are similar to child directories).
To create a list of the files for a day of CloudTrail data using this API, you retrieve the list of accounts from the child prefixes AWSLogs/ORG_ID/, then the list of regions from AWSLogs/ORG_ID/ACCOUNT_ID/CloudTrail/, then you can construct the prefix to retrieve the list of files.
def retrieve_file_list(month, day, year):
    logger.info(f"retrieving files for {year:04d}-{month:02d}-{day:02d}")
    all_files = []
    for account in retrieve_accounts():
        for region in retrieve_regions_for_account(account):
            files = retrieve_file_list_for_account_region_and_date(account, region, month, day, year)
            logger.debug(f"{len(files)} files for account {account}, region {region}")
            all_files += files
    logger.info(f"{len(all_files)} total files")
    return all_files


def retrieve_file_list_for_account_region_and_date(account_id, region, month, day, year):
    result = []
    prefix = f"{src_prefix}{account_id}/CloudTrail/{region}/{year:04d}/{month:02d}/{day:02d}/"
    # retrieve list of all files for this prefix
Traversing prefixes in this way is somewhat expensive: each API call takes about 25 milliseconds to complete. If you have a large number of accounts it might take several seconds to figure out the combinations of accounts and regions. An alternative is to generate your list of prefixes from a hardcoded set of accounts and regions; this is how Athena’s partition projection works. It’s faster, but you’d have to redeploy every time you added an account or region.
Aggregating the Source Files
CloudTrail log files contain a single JSON object, in which a top-level Records element holds an array of log events. AWS provides CloudTrailInputFormat for Athena, which allows it to read files structured in this way, and the CloudTrail Console will generate DDL for an Athena table that uses this format (DDL, I might note, that seems more up-to-date than what you’ll find in the documentation).
However, I prefer newline-delimited JSON (aka NDJSON). This is a standard way to represent multiple JSON objects in a single file: each physical line contains a stringified JSON object; no pretty-printing allowed. It’s readable by Athena, as well as by other file readers such as Spark and Glue.
The aggregation code is built around a Python “generator” function that takes a list of files and provides a single record at a time to a for loop. I write numbered output files whenever I’ve accumulated 64 MB worth of data, which translates to 10-12 MB after compression. Most days don’t have that many records, so there’s only a single file that’s around 4-6 MB.
def aggregate_and_output(file_list, month, day, year, desired_uncompressed_size = 64 * 1024 * 1024):
    file_number = 0
    cur_recs = []
    cur_size = 0
    for rec in retrieve_log_records(file_list):
        cur_recs.append(rec)
        cur_size += len(rec)
        if cur_size >= desired_uncompressed_size:
            write_file(cur_recs, month, day, year, file_number)
            file_number += 1
            cur_recs = []
            cur_size = 0
    if len(cur_recs) > 0:
        write_file(cur_recs, month, day, year, file_number)
In-memory aggregation
You might look at the previous function in horror: why am I holding everything in memory?
The answer is that, historically, Lambda provided only 512 MB of writable disk space. It was all too easy to exceed that, especially if the same Lambda execution environment handled multiple requests. By comparison, you could allocate up to 10 GB of RAM, and the garbage collector would be responsible for cleaning it up. Although Lambda now gives you up to 10 GB of ephemeral disk, the issue of keeping it clean remains, which means that you have to write extra code.
I tend to be profligate with my use of memory in general. This example program maintains an array of stringified JSON objects, which it then writes into an in-memory buffer, which is converted to binary and then GZipped. In other words, I copy the same data multiple times. However, this makes for simpler code, and developer time is much more expensive than extra memory.
Handling Errors
One of my basic principles is that it’s better for a data pipeline to fail completely and make it known, rather than fail partially and not tell anyone. If you combine that with idempotent processes that can be rerun as often as needed, you’ll have a resilient pipeline (albeit one that might require human intervention at times).
In the case of this data aggregation task, there are a few places where things are likely to break:
- Incorrect permissions. These will get flushed out during development, but may rear their heads again over the lifetime of the pipeline.
- Incorrect source file format. We’re reading files generated by CloudTrail, but in the general case you may be getting data from sources that change. The parser will throw if it isn’t given JSON source data, and the code that processes the parsed data will throw if it doesn’t have the expected format.
- Running out of memory. The aggregation code keeps track of the amount of data that it holds, but you could find that you’ve downloaded a multi-gigabyte source file.
- Running out of time. Lambdas time out after 15 minutes. If you have a large number of files or a lot of rows in the source files, you could conceivably reach this limit.
Using CloudWatch Metrics to identify runtime problems
There’s a simple way to identify problems with this pipeline: neither of the queues should have any messages in them. For the dead-letter queue, any message represents an error in the Lambda; for the trigger queue, a message that remains in the queue for more than an hour indicates that the Lambda isn’t being invoked.
This information is provided by the ApproximateNumberOfMessagesVisible metric, which is reported whenever the queue is active (has messages in it, or has had messages in it in the last six hours). The normal state of both queues is inactive: they receive a message in the middle of the night, and it should be processed quickly. So when configuring an alarm on this metric, you want to treat missing data as OK.
In addition to the built-in alarms on the queues, you can have the Lambda function report custom metrics, such as the number of records processed. This is particularly useful when you’re aggregating data such as clickstream data from an ap): if you expect 100,000 records per day on average, then setting an alarm if you’re over 125,000 or under 75,000 can give you insights as to your overall business.
Logging
I’m a logging zealot: I’ve learned the hard way that it’s often the only tool that you have to debug things that run in the middle of the night. But it can only point you in the general direction of a problem, for later debugging. Effective logging is all about providing accurate direction rather than a generic hand-wave.
To that end, my example program provides two different levels of logging. At “info” level it reports general activity, letting you see at a glance what parts of the Lambda executed:
INIT_START Runtime Version: python:3.11.v27 Runtime Version ARN: arn:aws:lambda:us-east-1::runtime:aaa0628b7c27cf9a6da9328d61875e549fca53968fbabf523c9ce564bb817574
START RequestId: fa710139-21ef-5ea3-a307-5f7c5f62684f Version: $LATEST
[INFO] 2024-02-13T14:27:35.677Z fa710139-21ef-5ea3-a307-5f7c5f62684f invoked from EventBridge scheduler
[INFO] 2024-02-13T14:27:35.677Z fa710139-21ef-5ea3-a307-5f7c5f62684f retrieving files for 2024-02-12
[INFO] 2024-02-13T14:27:49.058Z fa710139-21ef-5ea3-a307-5f7c5f62684f 3911 total files
[INFO] 2024-02-13T14:31:00.793Z fa710139-21ef-5ea3-a307-5f7c5f62684f writing 17648 records to s3://com-chariotsolutions-cloudtrail-aggregation/cloudtrail-daily/2024/02/12/000000.ndjson.gz
END RequestId: fa710139-21ef-5ea3-a307-5f7c5f62684f
REPORT RequestId: fa710139-21ef-5ea3-a307-5f7c5f62684f Duration: 205457.51 ms Billed Duration: 205458 ms Memory Size: 512 MB Max Memory Used: 181 MB Init Duration: 449.71 ms
But, it also reports information at “debug” level: every file that it reads or writes, along with calls to retrieve file and prefix listings. This information is critical to debugging: if you see that there’s an error processing a specific file, you can pull that file onto your workstation and examine it in detail. Maybe it has bad data, maybe it has good data that you weren’t expecting.
However, you don’t want to have debug-level logging enabled all the time; it would be overwhelming. So one technique that I use with Lambdas is to set the logging level based on an environment variable. For normal operation you get info-level messages, but enabling debug-level is a matter of making a change in the Console rather than in code.
logger = logging.getLogger(__name__)
logger.setLevel(os.environ.get("LOG_LEVEL", "INFO"))
Conclusion
At this point, I have a Lambda that can aggregate CloudTrail log files into NDJSON. However, I’m not stopping here. If you look in the example repository you’ll find that there’s also a Lambda to aggregate by month and write the results as Parquet. But first, I want to look at the performance of the Lambda we have, and the tools for evaluating whether that performance is good or bad. That will be my next post.