Introduction
Application development has changed dramatically from the time I first began working in the area of software development. In today’s world, users are no longer satisfied with an application that responds to a request within a few seconds. The proliferation of ever smarter devices such as phones has led people to consume more data than ever before and left them craving it at a faster pace. By now we are all fairly accustomed to receiving and reacting to notifications many times each day. For example, a person will likely take an alternate route to their destination after receiving a traffic alert on their phone.
Reactive Applications
The ability to react in such a manner is not only important to an individual but also to an organization. In today’s world, being able to make decisions quickly can give an organization the competitive edge. In some cases it is no longer adequate for a business to analyze data on a daily or weekly basis. For many organizations, it is imperative that they analyze data in real time or very close to real time. The frameworks that exist today allow applications to react to data as a stream of events just as a person would. These types of applications are often referred to as "Reactive Applications". Reactive applications have the four attributes shown in the diagram below:
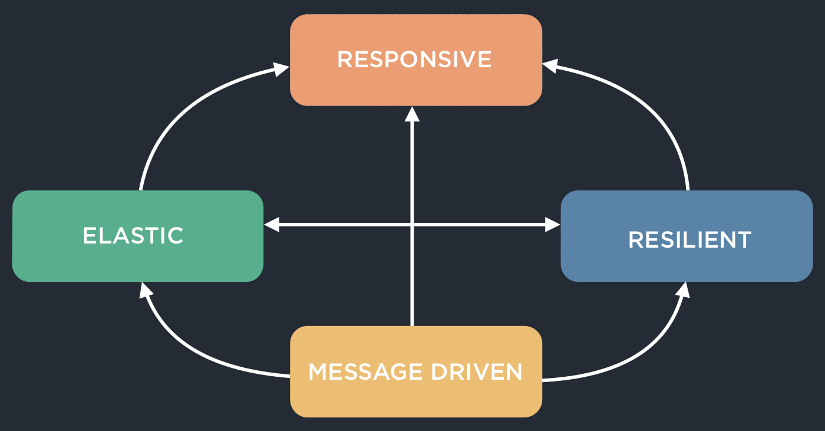
Responsive:
The primary goal of a reactive application is for it to provide instantaneous response times under varying loads and failure conditions. The event driven nature of reactive applications provide the user with responsive feedback to not only their own interactions with the user interface but to changes in data throughout the application. Data within the application is processed as a constantly moving stream of events. In order for an application to remain responsive under different loads and failure scenarios it must be both scalable and resilient.
Resilient:
The application must continue to respond, even in the face of failure. A failure in one part of the application should not cause a cascading failure throughout the remainder of the application. The application must also be self healing. If a particular instance of an application module, fails, another instance should automatically take over. This is achieved through isolation of components, replication of data and clustering of application modules.
Elastic:
The application should respond to changes in load and resource requirements. As demand for the application increases, the application should be able to allocate additional resources and scale with the demand.
Message Driven:
Components of the application should communicate through the passing of immutable messages in an asynchronous manner. Using immutable messages not only simplifies concurrency in applications, but helps to ensure isolation of components which allows for resiliency. The sending of messages must be done with location transparency. What this means is that the dispatcher of the message does not have to know where the receiver of the message is located. This is required because in a clustered application, the receiver of that message can be running on any given node in the cluster. A full definition of the attributes of reactive applications can be found in the Reactive Manifesto. This article will focus primarily on the message driven and responsive attributes.
Background
I had recently come off of a three year contract and found myself with some time on my hands so I had decided to utilize that time to investigate some things I had been interested in doing for a while. In particular, I was interested in working on an application that interfaced directly with some sort of small device. The director of our company, Don Coleman, had done a good bit of work with small devices so I spoke to him about the possibility of building a small application around those devices. He agreed to it and offered to assist from the hardware end.
Watch a short video of me describing the reasoning behind creating this demo, the technologies used, and why I’m excited about the growth of reactive technologies.
Our director of training, Ken Rimple, was researching the Angular 2 JavaScript framework at the time and offered to build the UI for the application. We eventually decided that we would build a demo to display at our booth at the 2016 South by SouthWest conference. We at Chariot Solutions have embraced the concept of reactive applications so we decided we’d like to show its potential in the context of device data acquisition. We thought that the best way to show the responsive and event driven nature of a reactive application was to demonstrate it through real-time updates of the user interface in response to interactions with devices. In short, what this means is that you should be able to plug in a new device and see a visual response to user interactions with the devices.
Device Messaging Architecture
Small devices like the Arduino or Raspberry Pi are inexpensive and available from many sources such as Adafruit. In our case we had quite a few Arduino and ESP8266 devices lying around so we decided to use them in the demo. The device used for the demos could have been any device such as a phone, FitBit, lighting controls, etc.
One of the hurdles you’ll find in working with these small devices is that they have limited resources. For example, one of the larger Arduino modules, the Mega has only 8k of ram on-board. Communication with these small devices is typically achieved through message brokers that support the MQTT protocol. The MQTT protocol is a compact binary protocol with very little overhead (2 bytes per packet) which allows for very fast data transfer.
The fact that the publish-subscribe libraries are also small has made it the popular choice for use in small devices. We chose Mosquitto as the broker for the demo because it was easy to configure and was available at no cost. For production environments you should consider something more robust that supports clustering. One that looks very interesting is the eMQTT broker built in Erlang. It was still in beta at the time we constructed the application so it wasn’t used but version one has since been released. A comprehensive list of brokers and their features can be found here. Nick O'Leary’s PubSubClient was used for publishing data from the devices to the broker.
Middleware Architecture
For the middleware, We chose to build a CQRS application with the LightBend (formerly TypeSafe) stack consisting of the Akka actor, http, stream and persistence libraries. We choose to go with CQRS because in future iterations, we will likely be persisting large amounts of device data and denormalizing the data for queries so it seemed to fit well in this scenario. The vision for this application was that it would stream the data from the source all the way up to to the UI so that the user can experience immediate feedback.
The latest revision of Akka’s streaming api in the 2.4.3 release from April 2016 is fairly robust and Akka http’s websocket support allows for fairly straightforward streaming of data from a source right out through the websocket. The source in this case was an actor that received a constant stream of remote messages from a device monitor and forwarded them through a websocket connection to the user interface. For the persistence of queryable data, I chose to use the experimental Akka PersistenceQuery since it will be replacing the existing PersistentView and it has the ability to process the journal as an ongoing stream which makes it useful for the purpose of running continuous denormalization of data for responsive querying. This posting is the first in a series of tutorials that will review how to build an Internet Of Things application in Scala.
User Interface Architecture
The user interface was built using Angular 2 and Node.js. AngularJS was chosen for its ability to extend the the HTML syntax so that it allows you to express components in a manner that is easy to reason about. In addition to this, its data binding and dependency injection framework eliminates boilerplate code that you would typically have to write. Node.js was chosen for its efficient event-driven, non-blocking I/O model which conforms with the message driven requirement of a reactive application.
Topology
Lets look at the topology of the write side of the CQRS application.

The devices shown on the left-hand side publish their presence to the message broker when they first come online. On the “write” side of the application there is an instance of an actor referred to as the "Presence Monitor". Its purpose is to listen to the message topic named “presence”. When it receives a message on that topic for a device that it has not yet recognized, it will spin up an actor whose responsibility is to gather and persist incoming data for a single device. It will also journal an entry stating that a given device is now registered as a recognized device. Each message containing readings for a device is also persisted in a journal as an event. Once that event is persisted, a message is sent to a remote actor on the read side of the application.
This is represented by the device event stream lines you see coming out of the device monitors. If the presence monitor encounters an exception or when the write side of the application is first started up, the first thing it will do is rehydrate its state from the journal and reinitialize monitor actors for any previously registered devices. This gives us the ability to recover and resume monitoring of devices upon startup or when error conditions occur that cause a shutdown of the actor. The journal you see on the right hand side is a shared journal which is used also also by the read side application to extract persisted events and generate data in a form optimized for efficient querying. Devices will also unregister themselves is no data is received from the device for a preconfigured amount of time. In this case, an unregister event is persisted in the journal and dispatched to the read side.
Lets now look at the “read” side of the application.

At the bottom of the image you’ll notice the remote event listener. This is responsible for receiving any device events and forwarding that data to any running instance of what is referred to as a "device data provider". A device data provider is an actor that receives messages containing device data and forwards those messages onto a websocket. Each instance of a device data provider is initialized when the user interface requests data for a given device. The “processor” shown at the upper left is responsible for extracting device registration data from the journal and updating the devices table in Cassandra. When a device becomes registered or unregistered those events are persisted in the journal on the write side of the application. The processor will then evaluate those events and update the devices table accordingly by adding or removing a device registration. The device registration provider provides the UI with a stream of device registration events via a websocket. When a request is received for device registrations, the application first creates a stream from the existing records in the devices table. Each device entry in the table is converted into a device add event. The UI then receives those events and processes them as registered devices. The initial stream from the devices table is a finite stream. The Phantom DSL library was used to wrap the calls to the Cassandra database. This library provides a method that will return an instance of a play Enumerator. The Play library has utilities for converting enumerators to stream publishers. These publishers are then used as the initial source of the stream. Because, we want to also react to any new register and unregister events that source is concatenated with a source of continuing events from the journal. This allowed us to provide the UI with a single websocket that can return a stream of events representing the initial device registrations as well as any future events that may occur.
Lessons Learned
The biggest lesson learned is that you can not depend on a device to maintain its connection. Device connections will come and go with network and power interruptions. The software on our test devices was built to register the device when it booted up. On the application side, if a device was not available for a configured period of time, it would deregister itself and the monitor for that device would be shut down. We set that time out to one day for our testing. This allowed us to account for some of the interruptions. If it the device did not come back online in that period of time, we could just restart it and it would register itself again. In a real application it may not be a good option to request that a device be rebooted. You may want to occasionally send a registration request from the device to maintain a connection.
Another thing I’d like to point out is that for the read side device data, we sent remote actor messages directly to the read side rather than read the data from the journal and place it onto the individual websockets for consumption by the user interface. This was done because we wanted a real or very near realtime response from the device to the UI. Most journals like the implementation of the Akka Persistence Cassandra driver we used revert to polling to produce an endless stream and it didn’t seem to fit well with the streaming of live data to the UI. In many cases, you would not be dealing with data at such a high rate so it may be appropriate in those cases.
One final thing I’d like to mention is that we decided to not handle back pressure at the source of the stream of data to the user interface. We opted instead to drop the data if the UI was not able to handle it at a fast enough pace. As it turned out the Angular 2 based user interface was able to keep up nicely and dropping a few milliseconds of data in this case didn’t have much of an impact to the representation of the graphs. For the device data we could potentially for future analytics or aggregation, we can resort to optimized extractions of the data captured by the device monitors and persisted into the journal.
Visualization Screenshots
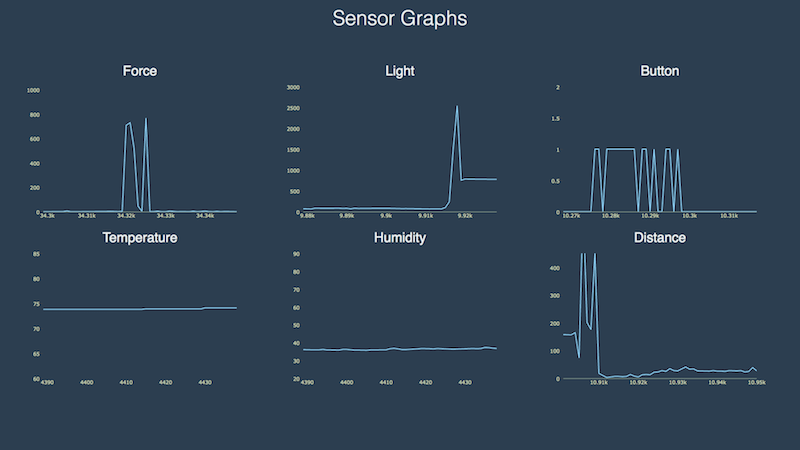
Here’s a screenshot of the Angular2 Visualization application:
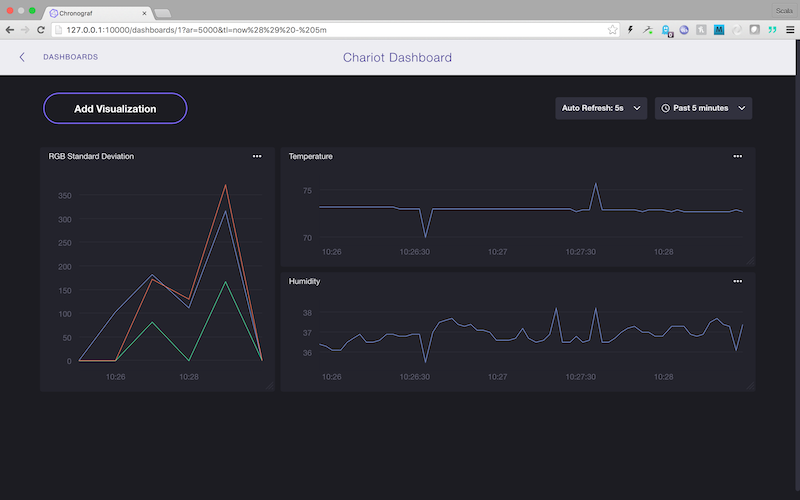
We’ve also experimented with visualization tools such as Chronograf for historical time-series data analysis: