
In my last post, I developed a data pipeline to aggregate CloudTrail log files. When I ran this pipeline against Chariot’s CloudTrail repository, it took nearly four minutes to process a typical day’s worth of data. That feels like a long time, and like most developers I want to optimize everything.
First Step: Add More Memory
Before digging into the cause of a Lambda performance problem, I try bumping up the amount of memory it’s assigned. The reason is that a Lambda’s CPU allocation is based on its memory allocation: every 1,769 MB of memory translates to one virtual CPU (a strange number, associated with a nebulous concept).
Increased CPU primarily helps “cold start” invocations: the first invocation with a new execution environment. This is because languages such as Python or Java perform a lot of initialization tasks when they first run, and those tasks can be very CPU-intensive.
To put some numbers to that claim: by default a Python Lambda created in the Console gets 128 MB, or 1/14th of a vCPU. With that configuration it will take over 3 seconds just to import the boto3 library. Increasing the memory to 1,769 MB reduces that time to 200 milliseconds.
For a long-running Lambda, however, increasing memory and CPU won’t help unless it’s CPU-bound. And when I increased the allocated memory of my Lambda, from 512 MB to 2048 MB, its runtime didn’t change.
Scoping the Problem
Next, I like to do some “back of the envelope” calculations. From the logs, I see that there were 3,911 source files, and 17,648 records. Selecting the list of files took around 13 seconds, while processing those files took 205 seconds. That last number translates to 52 milliseconds per file.
For comparison, I’ve run some performance tests on S3 (from EC2, not Lambda), and have seen a consistent 15 milliseconds to download small files. The example Lambda doesn’t just download files, it also decompresses them and parses them as JSON, so 52 ms doesn’t seem out of line.
As a side note: the number of files in my example reflects Chariot’s environment, which includes multiple sandbox accounts. CloudTrail writes one file per account and region approximately every 15 minutes, or around 100 a day. If you only have one or two accounts, and only work in one region, you may not even notice a performance issue.
What Does X-Ray Say?
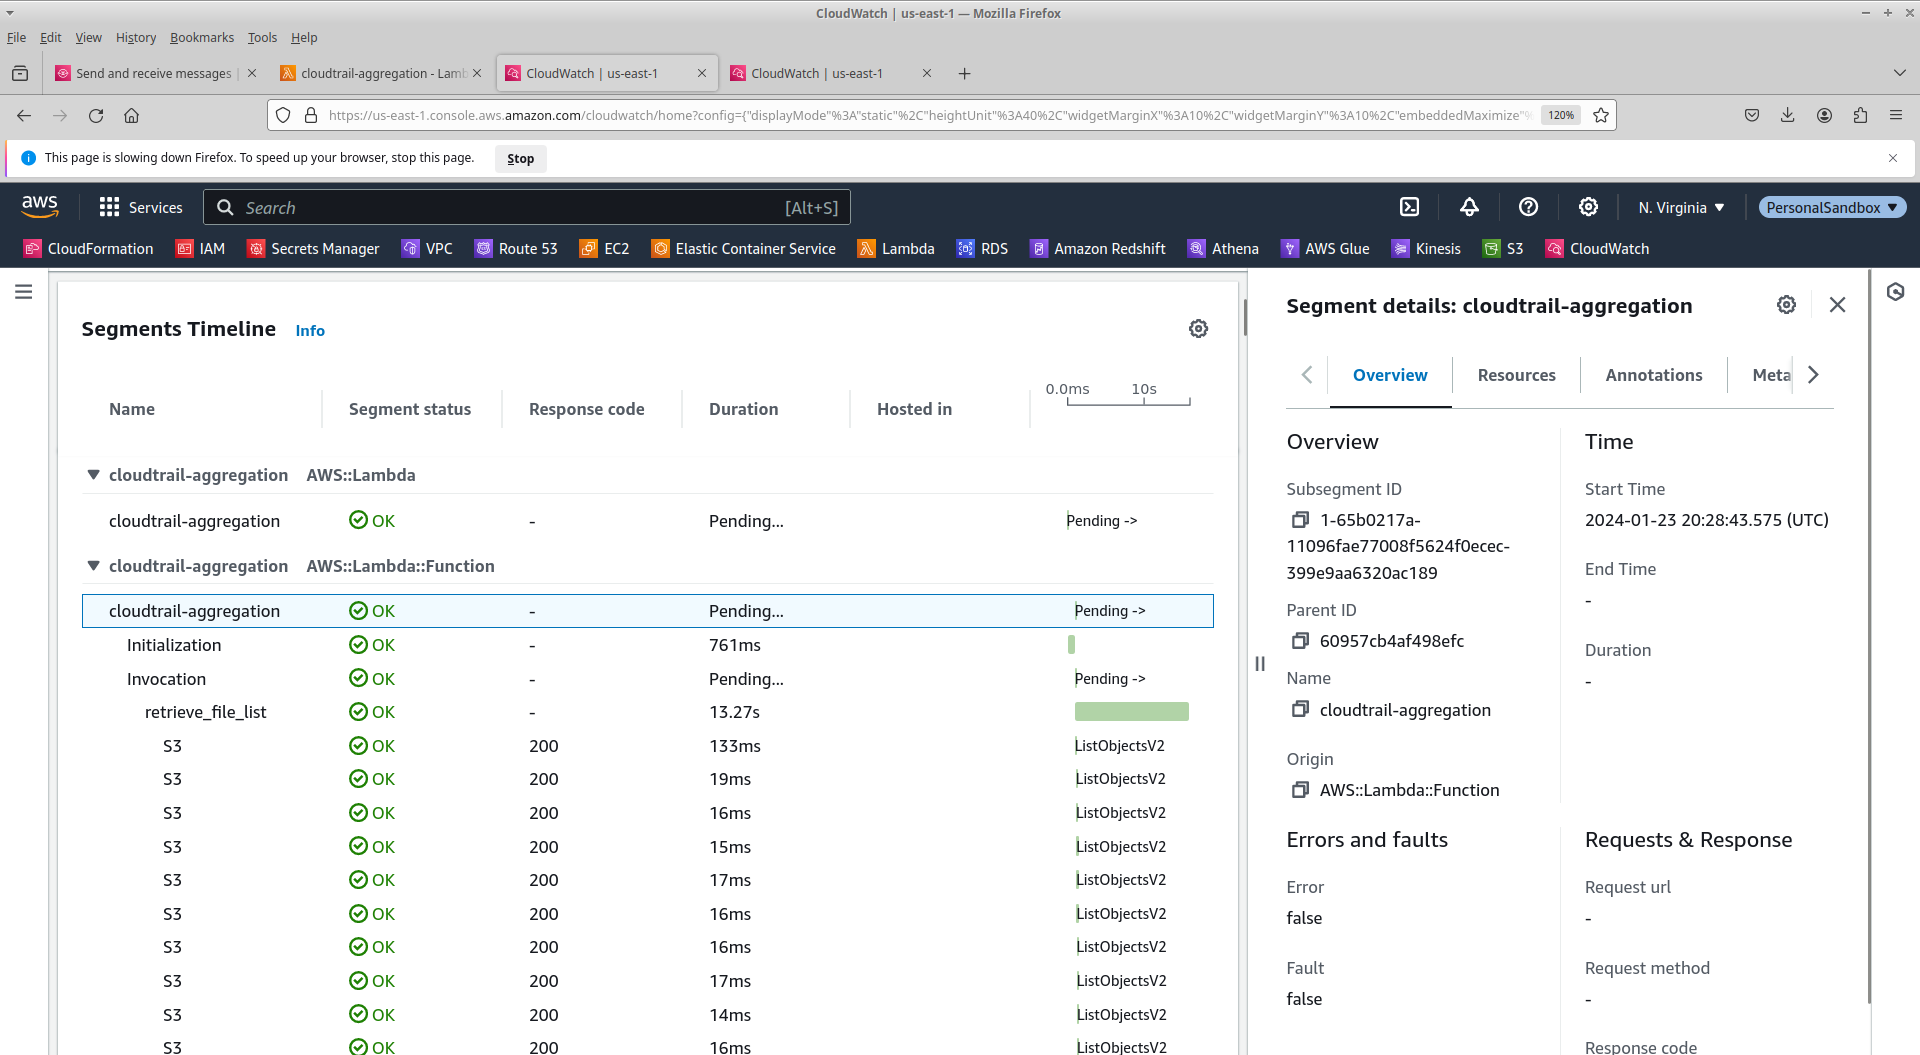
X-Ray is an AWS service that collects trace data for distributed applications. It’s well-integrated with Lambda: you can get basic execution timings by flipping one switch in the Console. For more detail, your code can define trace segments for individual functions, and you can patch the boto3 library to record segments for calls to AWS services such as S3.
Unfortunately, X-Ray isn’t designed to capture thousands of API calls. As far as I can tell, from retrieving the trace via the SDK, it only stores around 600-700 trace segments. And as you can see from this image, it has some trouble trying to display even that.
This isn’t to say that X-Ray isn’t a good service. For its intended use-case of tracing activity in a micro-service architecture, it’s great. And if you only have a few hundred files to process (ie, one or two accounts), it should be able to handle that.
How About the Python Profiler?
Python comes with a built-in profiler that’s easy to use: wrap your function call in a string and pass it to the cProfile.profile() function. Unfortunately, that simple approach doesn’t work with Lambda: the profiler appears to be unable to find the method to profile. I’m assuming that AWS modified the profiling library for some reason. Fortunately, there’s a work-around: you create a profiler object and then explicitly enable/disable it and print results:
profiler = cProfile.Profile()
profiler.enable()
aggregate_and_output(all_files, month, day, year)
profiler.disable()
pstats.Stats(profiler).sort_stats('tottime').print_stats()
I sorted the profile results by cumulative execution time, as this highlights what parts of the code will benefit from optimization. The actual output lists hundreds of functions; I’ve excerpted it below, looking at just the calls that I care about.
31596718 function calls (31400363 primitive calls) in 252.702 seconds
Ordered by: cumulative time
ncalls  tottime  percall  cumtime  percall filename:lineno(function)
1    0.043    0.043  252.764  252.764 /var/task/index.py:99(aggregate_and_output)
18699    0.170    0.000  248.831    0.013 /var/task/index.py:119(retrieve_log_records)
4002    0.061    0.000  247.582    0.062 /var/task/index.py:129(read_file)
4003    0.028    0.000  246.635    0.062 /opt/python/botocore/client.py:544(_api_call)
...
8324  210.584    0.025  210.584    0.025 {method 'read' of '_ssl._SSLSocket' objects}
Here’s the story that these results tell: my aggregate_and_output() function takes 252.764 seconds to run (note: this is a different run than the logs that I showed in the last post, so the numbers are different). Working down through functions sorted by cumulative execution time, you can see another couple of functions in my Lambda, then a call to the boto3 library, and at the bottom, 210.584 seconds in the read() function from the Python internal SSL library.
One thing that jumps out at me from this report is that each individual read() function call takes around 25 milliseconds, which is not out of line with the benchmarks I referenced earlier. But there are 8,324 calls, resulting in the high cumulative time.
What’s more, that’s about twice the number of calls that I expected, which makes me wonder if maybe the buffer that boto3 uses for these calls is too small. Unfortunately, while boto3 gives you many configuration options, buffer size isn’t one of them, so there’s no way to explore how that might change the overall performance.
Should it be Multi-threaded?
Given these results, could this Lambda benefit from multi-threading? In theory, yes: the reads can execute concurrently. However, there are two issues that get in the way.
The first is Python’s global interpreter lock (GIL), which prevents two threads from executing Python code concurrently. And while the SSL read() function isn’t affected by the GIL (because it’s native code), the program spends 40+ seconds outside of that function, in Python code that will be affected. Which means that the benefits of multi-threading are limited due to Amdahl’s Law.
Multi-threading also increases code complexity, and makes it more difficult to debug problems when they occur. You can’t simply spin up a new thread for each input file, because threads are a limited operating system resource. You need to coordinate the output of threads, and be prepared for out-of-order results. Tracking down errors is harder, because the file that caused an error might not be the one from the most recent log message. Shared mutable variables require mutexes or atomic test-and-set operations (fortunately, the boto3 library already does this for its shared connection pool). And multiple concurrent requests may cause performance problems for external services.
With that said, I wrote a version using Python’s ThreadPoolExecutor.map() function, and it runs in about half the time of the non-threaded version. However, it buffers an entire day’s worth of events in-memory (because coordination is hard!) so runs the risk of running out of memory.
Would Another Language Be a Better Choice?
Is Python the best language to implement this task? It’s an interpreted language, and there’s no shortage of articles on the Internet proclaiming how slow it is compared to compiled languages. But the biggest time sink was the call to the read() function, which is a native function.
In my opinion, Python’s strength is time-to-develop, and developer time is usually far more important than runtime. Moreover, Python is the “common tongue” of data engineering. Switching to a different language for one component of a company’s data infrastructure is a hard sell unless the performance benefit is dramatic.
Is This a Problem That Even Needs Solving?
This Lambda runs in the middle of the night. Nobody cares if it takes one minute to run or ten. Time invested in improving this Lambda’s performance is time that’s not available to work on something that’s user-visible.
But you might be worried that you’re running up a big bill: Lambda is pay-for-usage, measured in seconds. To answer that: 4 minutes at 512 MB equals 120 GB-seconds, or $0.002 per run (in US regions). Or, less than a dollar a year.
Finally, if you need to process a backlog, you can scale horizontally. With a concurrent execution limit of 8, a month’s worth of data takes around 20 minutes to process.
You may, however, have a Lambda that does need performance optimization. Maybe its runs are more visible to stakeholders; or maybe it takes longer than 15 minutes. In that case, in that case the techniques described in this post will help you out.
One technique that I haven’t discussed is breaking the pipeline into multiple stages, where each stage’s output serves as input for the next. That will be the topic of my next post, which takes the daily files and re-aggregates them into monthly files, changing the data format from JSON to Parquet.