
One of the risks with giving developers their own sandboxes is that they’ll forget to shut down EC2 instances, or RDS databases, or any of the other AWS services that come with a per-hour charge. It happens. I’ve done it, as have most of the developers I know. But there’s no reason to be surprised when the bill arrives: Amazon provides several tools that will let you monitor your environment and identify those costs before they become excessive. In this post I’ll walk through the steps I followed to find a forgotten Sagemaker notebook.
Before that, however, I need to point out the obvious: Amazon gives you lots of ways to spend lots of money. It’s as easy to spin up an EC2 instance with 16 processors and 128 GB of RAM as it is to spin up one with 1 processor and 1 GB of RAM. Part of saving money is making sure that your developers pick the appropriate tools for their job. And perhaps, as I described in my last post, using service control policies to help them do that.
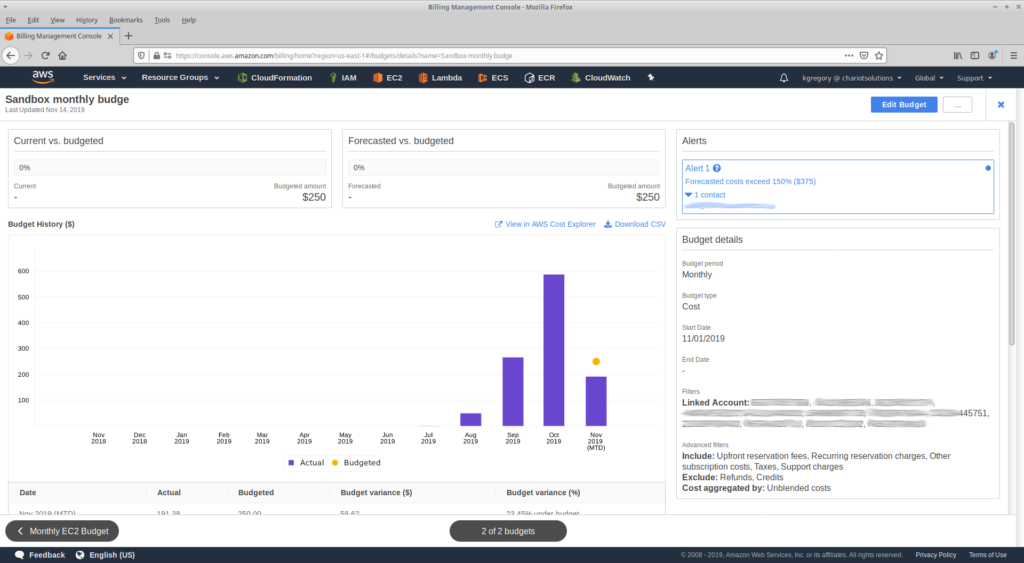
AWS Budgets are another proactive tool: you can create a budget that will notify you (via email or SNS) if your forecasted costs for the month are projected to exceed a predefined limit. You can create multiple budgets, each of which has a different amount and includes a different subset of your accounts or services. For example, we have a budget that covers all of our sandbox accounts, and sends email to a a group address if the monthly forecasted cost exceeds a (relatively low) amount, which is separate from the budget for our “primary” account.
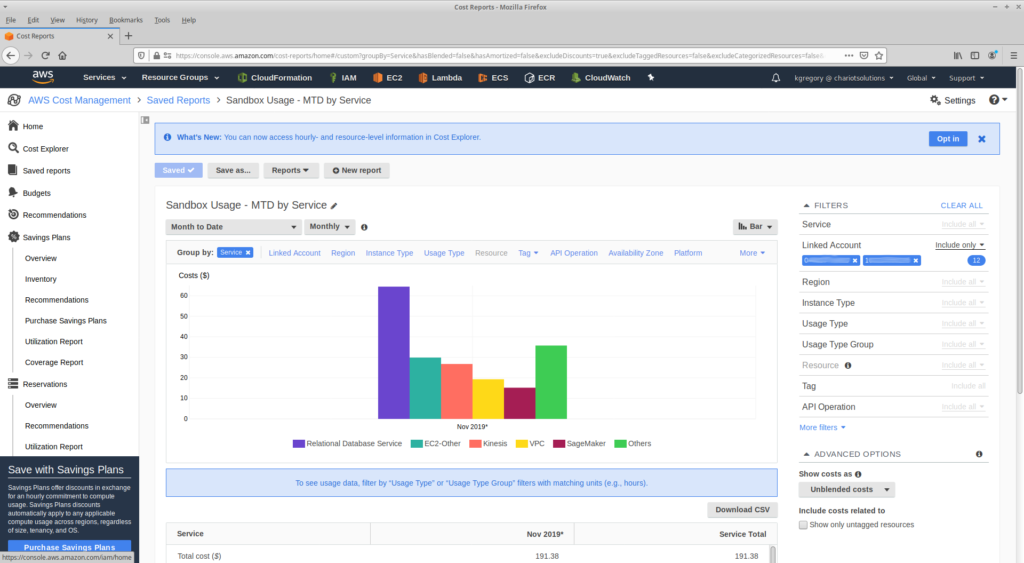
The second step is to make a habit of visiting the Billing Dashboard in the AWS Console. This page is a summary of your month-to-date spend across all accounts and services, a forecasted monthly bill, and actual prior-months bills for comparison. To get more detail, the Cost Explorer home page provides a daily breakdown of costs and current month trends. This last is extremely useful, as it will highlight unexpected usage.
If you see something unexpected, it’s time to dig in. I start with a predefined report for our “sandbox” accounts, that shows the month-to-date spend by service. As you can see here, Sagemaker is a relatively low spend, at just over $15 (which at least means it’s not a model-builder instance — those are expensive!). But it’s still more than I’d expect for someone who spent a day experimenting with the service.
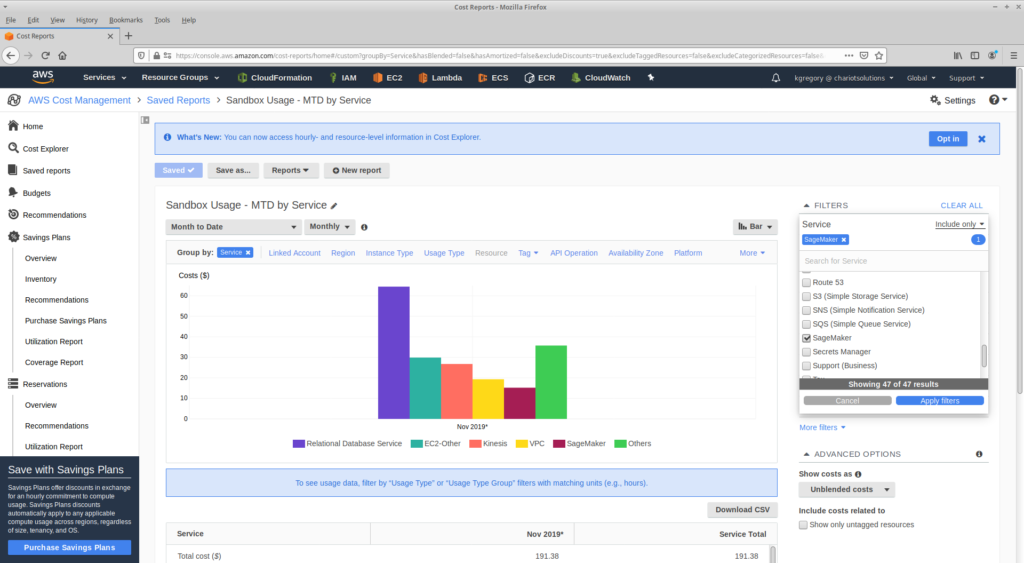
The next step is to add a filter, to look at just the Sagemaker costs.
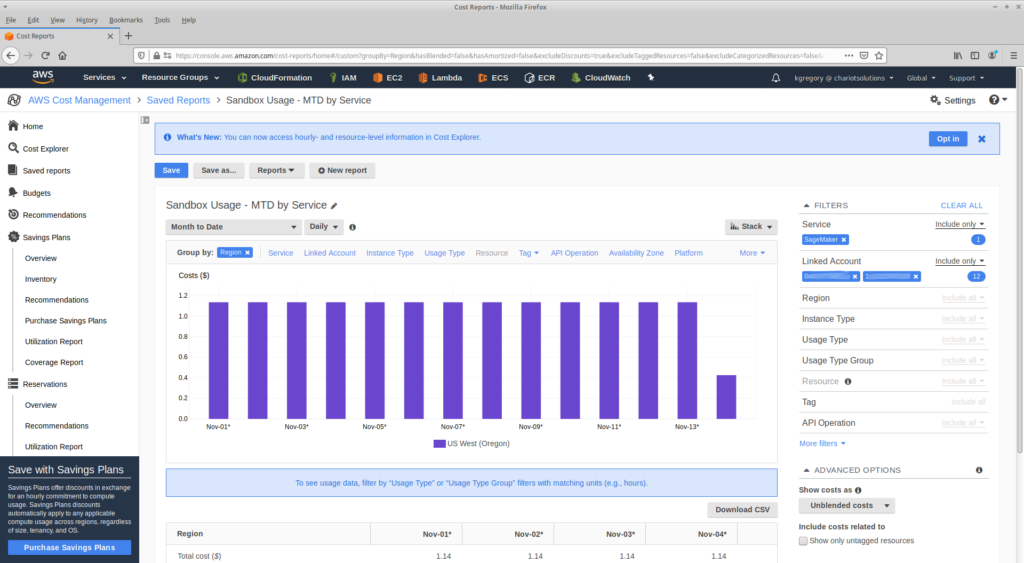
And then, switch to a daily view. Sure enough, it’s the same price every day; a sure sign that someone started an instance and forgot to shut it down.

Next up, group the costs by linked account. That tells us that the instance was running in our “Fall Marketing Event” sandbox … and since I’m writing this long after the event, there shouldn’t be anything running there.

Where is this instance running? To find this out, I switch the “group by” to region.
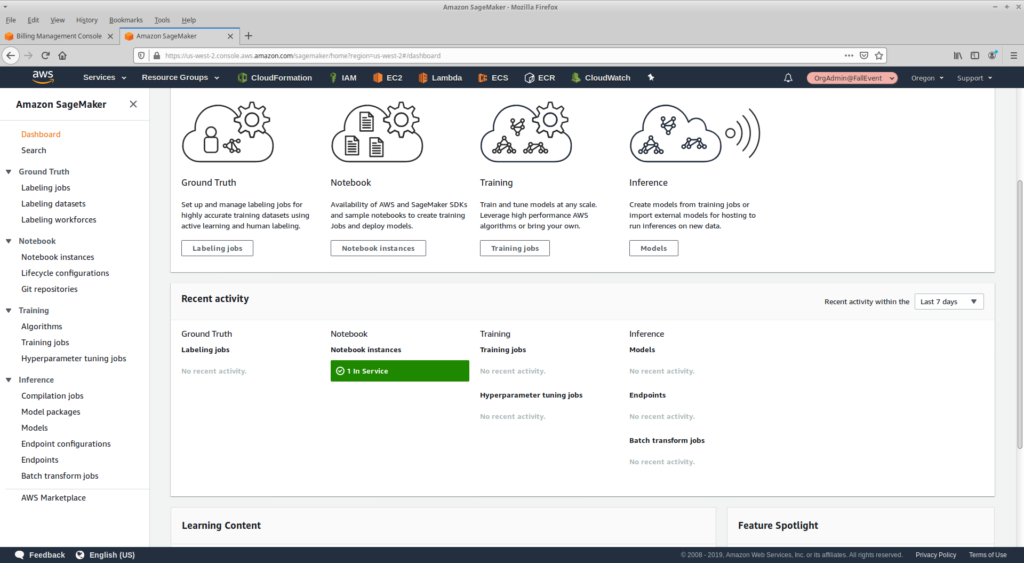
Next up: open the Sagemaker console, switch roles to the specific account, and region to the reported region. And there it is.
A message on Slack, asking if this is running intentionally, a sheepish response from the developer responsible, and I’ve saved the company enough money to fund the coffee supply for a few days. Now it’s time to look at those RDS instances …