
Do you have CloudTrail enabled? If not, stop reading and enable it now. Go ahead, it’s easy and the first trail is free.
OK, I see that you need more convincing. Let’s start with what CloudTrail is: it’s an audit log for AWS API calls. When you go to the CloudTrail console — even without explicitly enabling anything — you see a page like this:
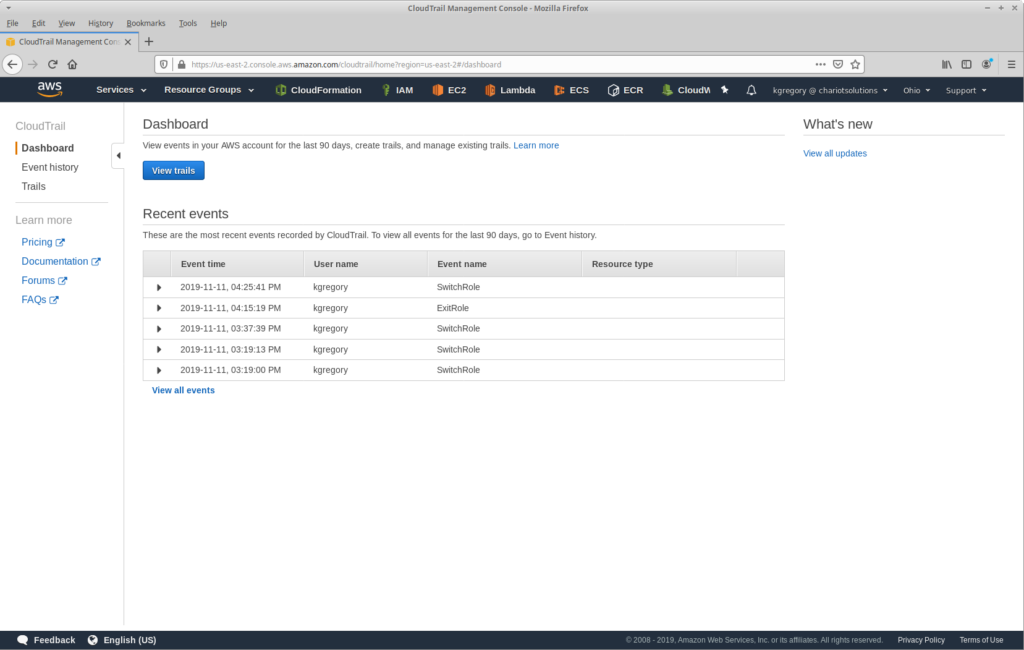
As you might guess from this image, I make extensive use of roles. In fact, I almost never do anything from our main account; all work happens in child accounts, and starts with a role switch. And this highlights one of the limitations of just looking at events in the console: it only shows events in the current account and region (and just the last 90 days worth).
To really exploit the power of CloudTrail, you need to create a trail: a record of events that’s saved to an S3 bucket. When you create a trail, you specify what regions it includes (you want all of them), and for an organization account you can additionally control whether it includes all child accounts (you want that too).
As I said above, the first trail is free, but that comes with two caveats: you will pay for the S3 storage for your events (which is low), and it only covers management events: the API calls that actually change your environment, such as starting a new EC2 instance or changing a security group’s rule.
For an extra charge of $1 per 1,000,000 log messages, you can track data events: Lambda invocations and S3 object operations. Depending on your security needs, this additional tracking may be valuable. For example, you could quickly identify cases where S3 content is being accessed from outside the AWS network (which could indicate a security breach). If the highest level of security is your goal, you should also write your trail events to a separate “audit” account (versus an in-organization account, where they can be deleted by anyone with sufficient privileges).
Those considerations are outside the scope of this post. Instead, I will focus on management events, and techniques for exploring and analyzing those events.
If you look at your configured CloudTrail destination bucket, you will see the following folder structure:
YOUR_BUCKET/
+---YOUR_OPTIONAL_PREFIX/
    +---AWSLogs/
        +---YOUR_ACCOUNT_NUMBER/
            +---CloudTrail/
                +---ADDITIONAL_FOLDERS
Under the CloudTrail folder you’ll see additional folders separating the events by region (if your trail includes multiple regions), year, month, and day. Under this deep tree of folders you’ll see lots of GZipped text files.
You might also see the folder CloudTrail-Digest alongside CloudTrail. This files under this folder are used for log file validation, which you can enable when creating the trail. Each file contains references to the actual log data files written in the past hour, with their digital signature. By comparing the signatures to the actual files, you can determine whether those files were modified after being delivered.
In a high-security environment the digest is important, but for this post all I care about are the files under CloudTrail folder, each of which contains JSON records that look like this:
{
	"eventVersion": "1.05",
	"userIdentity": {
		"type": "IAMUser",
		"principalId": "AIDAXXXXXXXXXXXXXXXXX",
		"arn": "arn:aws:iam::123456789012:user/kgregory",
		"accountId": "123456789012",
		"accessKeyId": "ASIAXXXXXXXXXXXXXXXX",
		"userName": "kgregory",
		"sessionContext": {
			"sessionIssuer": {},
			"webIdFederationData": {},
			"attributes": {
				"mfaAuthenticated": "true",
				"creationDate": "2020-01-03T14:30:49Z"
			}
		},
		"invokedBy": "signin.amazonaws.com"
	},
	"eventTime": "2020-01-03T14:40:30Z",
	"eventSource": "ec2.amazonaws.com",
	"eventName": "DescribeKeyPairs",
	"awsRegion": "us-west-2",
	"sourceIPAddress": "3.4.56.78",
	"userAgent": "signin.amazonaws.com",
	"requestParameters": {
		"keySet": {},
		"filterSet": {},
		"keyPairIdSet": {}
	},
	"responseElements": null,
	"requestID": "370d38b4-a767-45f2-9347-78cba962dc7b",
	"eventID": "5baea4da-8cf6-40dc-a5e6-72bdc5be5847",
	"eventType": "AwsApiCall",
	"recipientAccountId": "123456789012"
}
There’s a lot of information in the event: a quick glance shows you that at 14:40:30 UTC on January 3rd, the user kgregory executed a DescribeKeyPairs API call in the us-west-2 region. If you’re familiar with the event format, you’ll note from the responseElements section that I didn’t get any keypairs back. And if you’re familiar with IAM assumed roles, you’ll know that I made the call under an assumed role.
You could download these files and search through them manually, perhaps using a tool like jq. But I can tell you from experience, it takes a long time to download even a day’s worth of files (we have lots of child accounts, and therefore lots of files), and you’ll be paying S3 transfer charges of $0.09 and up per gigabyte.
A better solution is to analyze them in-place using AWS Athena. This can be a convenient way to run “canned” reporting queries, such as “show me all of the events yesterday that were in regions other than us-east-1 and us-east-2”:
select  eventtime, useridentity.accountid, useridentity.username,
        awsregion, eventsource, eventname
from    cloudtrail_logs
where   eventTime between '2019-11-06T00:00:00Z' and '2019-11-06T23:59:59Z'
and     awsregion not in ('us-east-1', 'us-east-2')
The main drawback with Athena is that queries can take quite a bit of time to run: this example took over a minute and a half, to return a few dozen results. It also requires you to have a good sense of what fields to search, and what values might be appropriate to for those fields.
In my opinion, a better alternative is to use a search engine, such as Elasticsearch with Kibana: it lets you quickly add and remove filters to explore your data. However, CloudTrail events are challenging to index, because the event structures vary so much between API calls. Indeed, if you simply post the events and let Elasticsearch dynamically map their fields, you’ll end up exceeding the default maximum field count. And you’ll find that many fields aren’t indexed due to the structure of the events.
To solve those problems, I created this Lambda: it’s invoked whenever a new CloudTrail file lands on S3, and writes the events from that file to Elasticsearch. There are also alternatives, ranging from plugins for self-hosted ELK stacks and Splunk, to various hosted service providers. I also saw one blog post that leveraged the existing CloudTrail-CloudWatch integration, along with the Amazon pre-built Lambda to move the logs into Elasticsearch. Clearly a lot of people have the same idea as me.
So, once you’ve got your logs into a search engine, what do you do? I’m going to give a few examples, but these are just a start. One of these nice features of Kibana is that the entire query is contained in the URL, so all you’ll need to do to replicate these queries is replace ENDPOINT in the provided links with your cluster’s hostname.
When you first go to Kibana’s “Discover” tab, you’re faced with a list of entries that show all of the information in the raw events (in this and future screenshots, I’ll be blurring or replacing anything that might be sensitive):
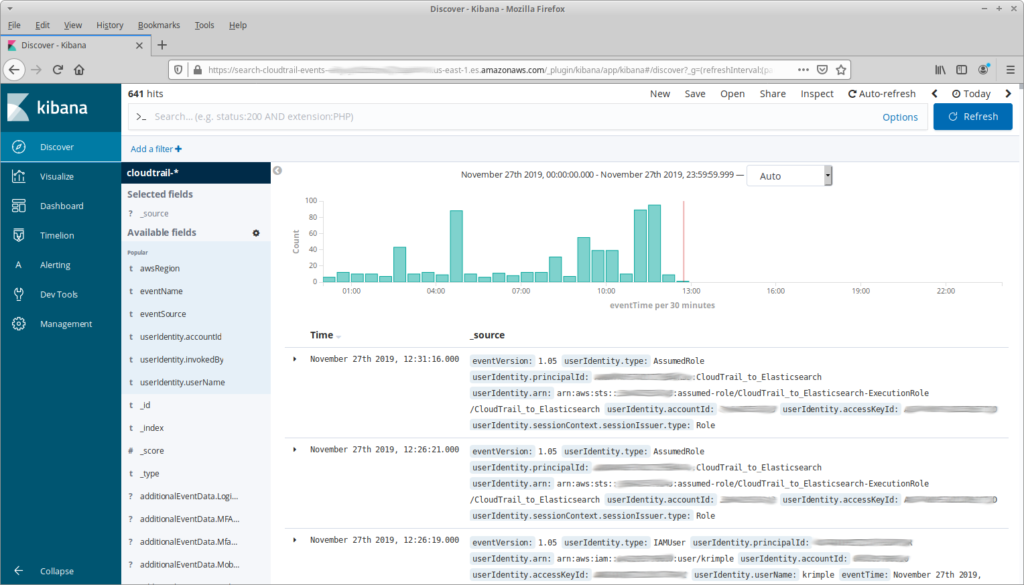
That’s a bit overwhelming (and it doesn’t include any complex events!), so let’s start by reducing the number of fields shown:
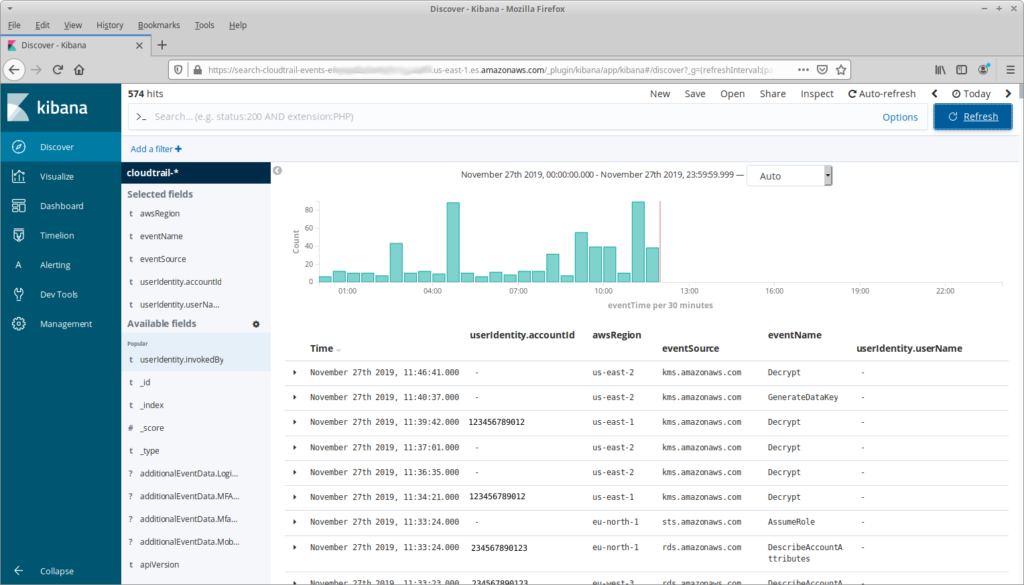
My reasons for choosing these fields are straightforward: we want to see what API calls have happened, in what account and region. And userIdentity.userName seems like a useful field as well, but why is it blank?
The answer is that identity in AWS varies depending on the request, and a lot of requests happen without a “user”. For example, the Decrypt call in the first line is happening as part of the internal operation of an RDS database; the Decrypt in the third line is the result of a Lambda invocation. For the former there’s not much information in the userIdentity object, you have to dig into the request parameters. For the latter, you can get information from userIdentity.principalId or userIdentity.arn. But then we get to the rows at the bottom, which represent API calls from AWS TrustedAdvisor; for these we’d want userIdentity.invokedBy.
The foregoing highlights the big problem with exploring CloudTrail logs, and the reason that a search engine is the way to go: the fields in any given event depend on the API call and invoker. To truly understand who (or what) invokes a request, you need to look at specific fields, but trying to do that across an entire trail is no better (or easier) than reading the raw JSON files.
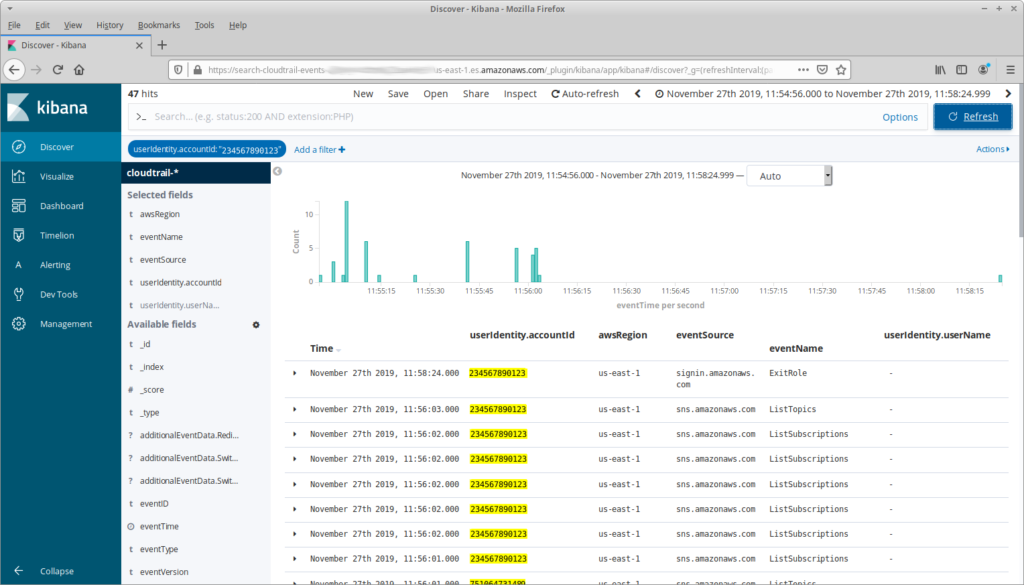
So, if you’re exploring, then the first thing you need to do is decide what you’re looking for and pick fields and filters that are appropriate. For example, we might really care about the API calls that are actually invoked by a person. We can do this by adding a filter that only shows rows where userIdentity.userName has a value:
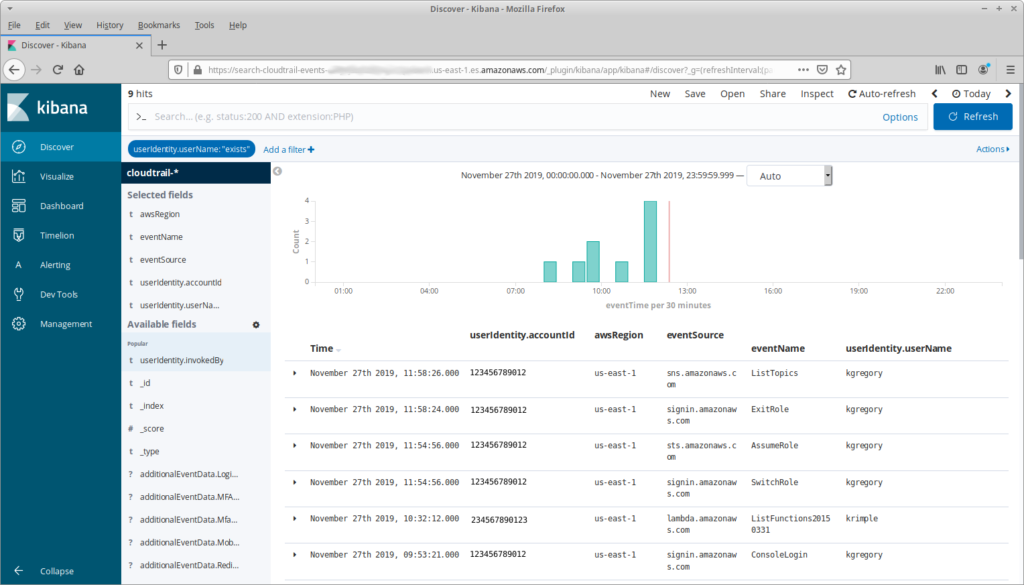
There’s not a lot happening here. Partly, that’s because it’s the day before Thanksgiving and nobody is in the office. But there’s another reason: note that at 11:54:56 I assumed a role, and at 11:58:24 I exited that role, switching back to my primary user. What happened in the three and a half minutes between those actions?
Finding this out takes a little bit of exploring. First I need to look at the details for the AssumeRole API call, specifically requestParameters.roleArn. This identifies the role that I switched to, including its account ID. From there I can filter the events to that account, and I can limit the time range to the period where I had assumed the role:
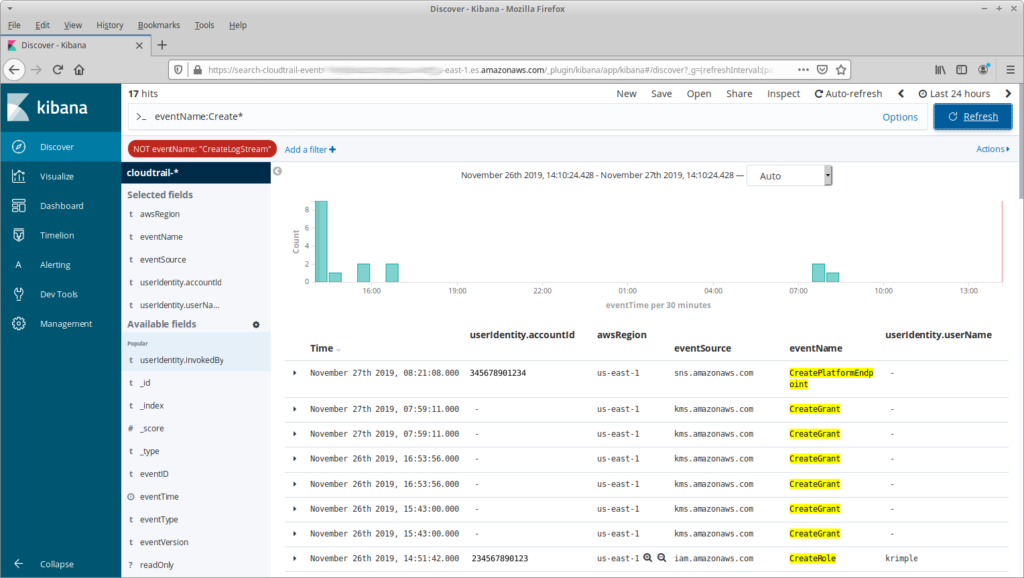
Another common task is finding all of the “Create” calls in the past 24 hours. This is a simple matter of using the Kibana search bar, which uses a concise field:term format: if I give it eventName:Create* it will show all events that start with “Create”. Just that term, however, may result in a lot of noise: I don’t care about my Lambda functions creating log streams, so I also filter out CreateLogStream events.
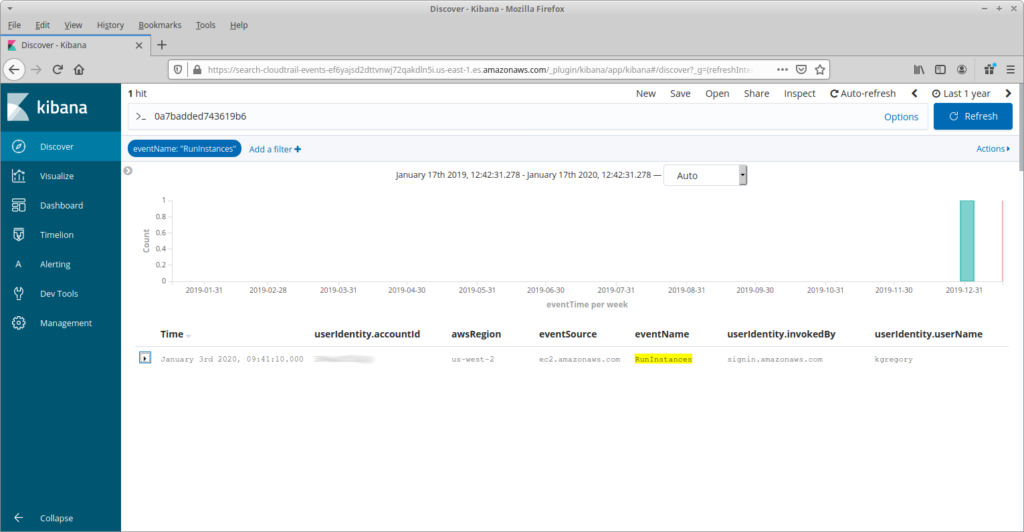
One last example. If you recall my previous post, I used Cost Explorer to find a Sagemaker Notebook that someone had left running, and sent a message on our Slack channel to find out who had started it. But what if nobody had replied? To find that person I add a filter on RunInstances API calls, expand the date range, and use the free-form text field to search for the instance ID. Less than a second later, and I have my culprit … oh, I better shut that instance down.
To summarize: CloudTrail is one part of a complete SIEM (security information and event management) solution. It provides a retrospective on what has happened in your AWS environment, but needs to be paired with proactive measures for a complete solution.